Math
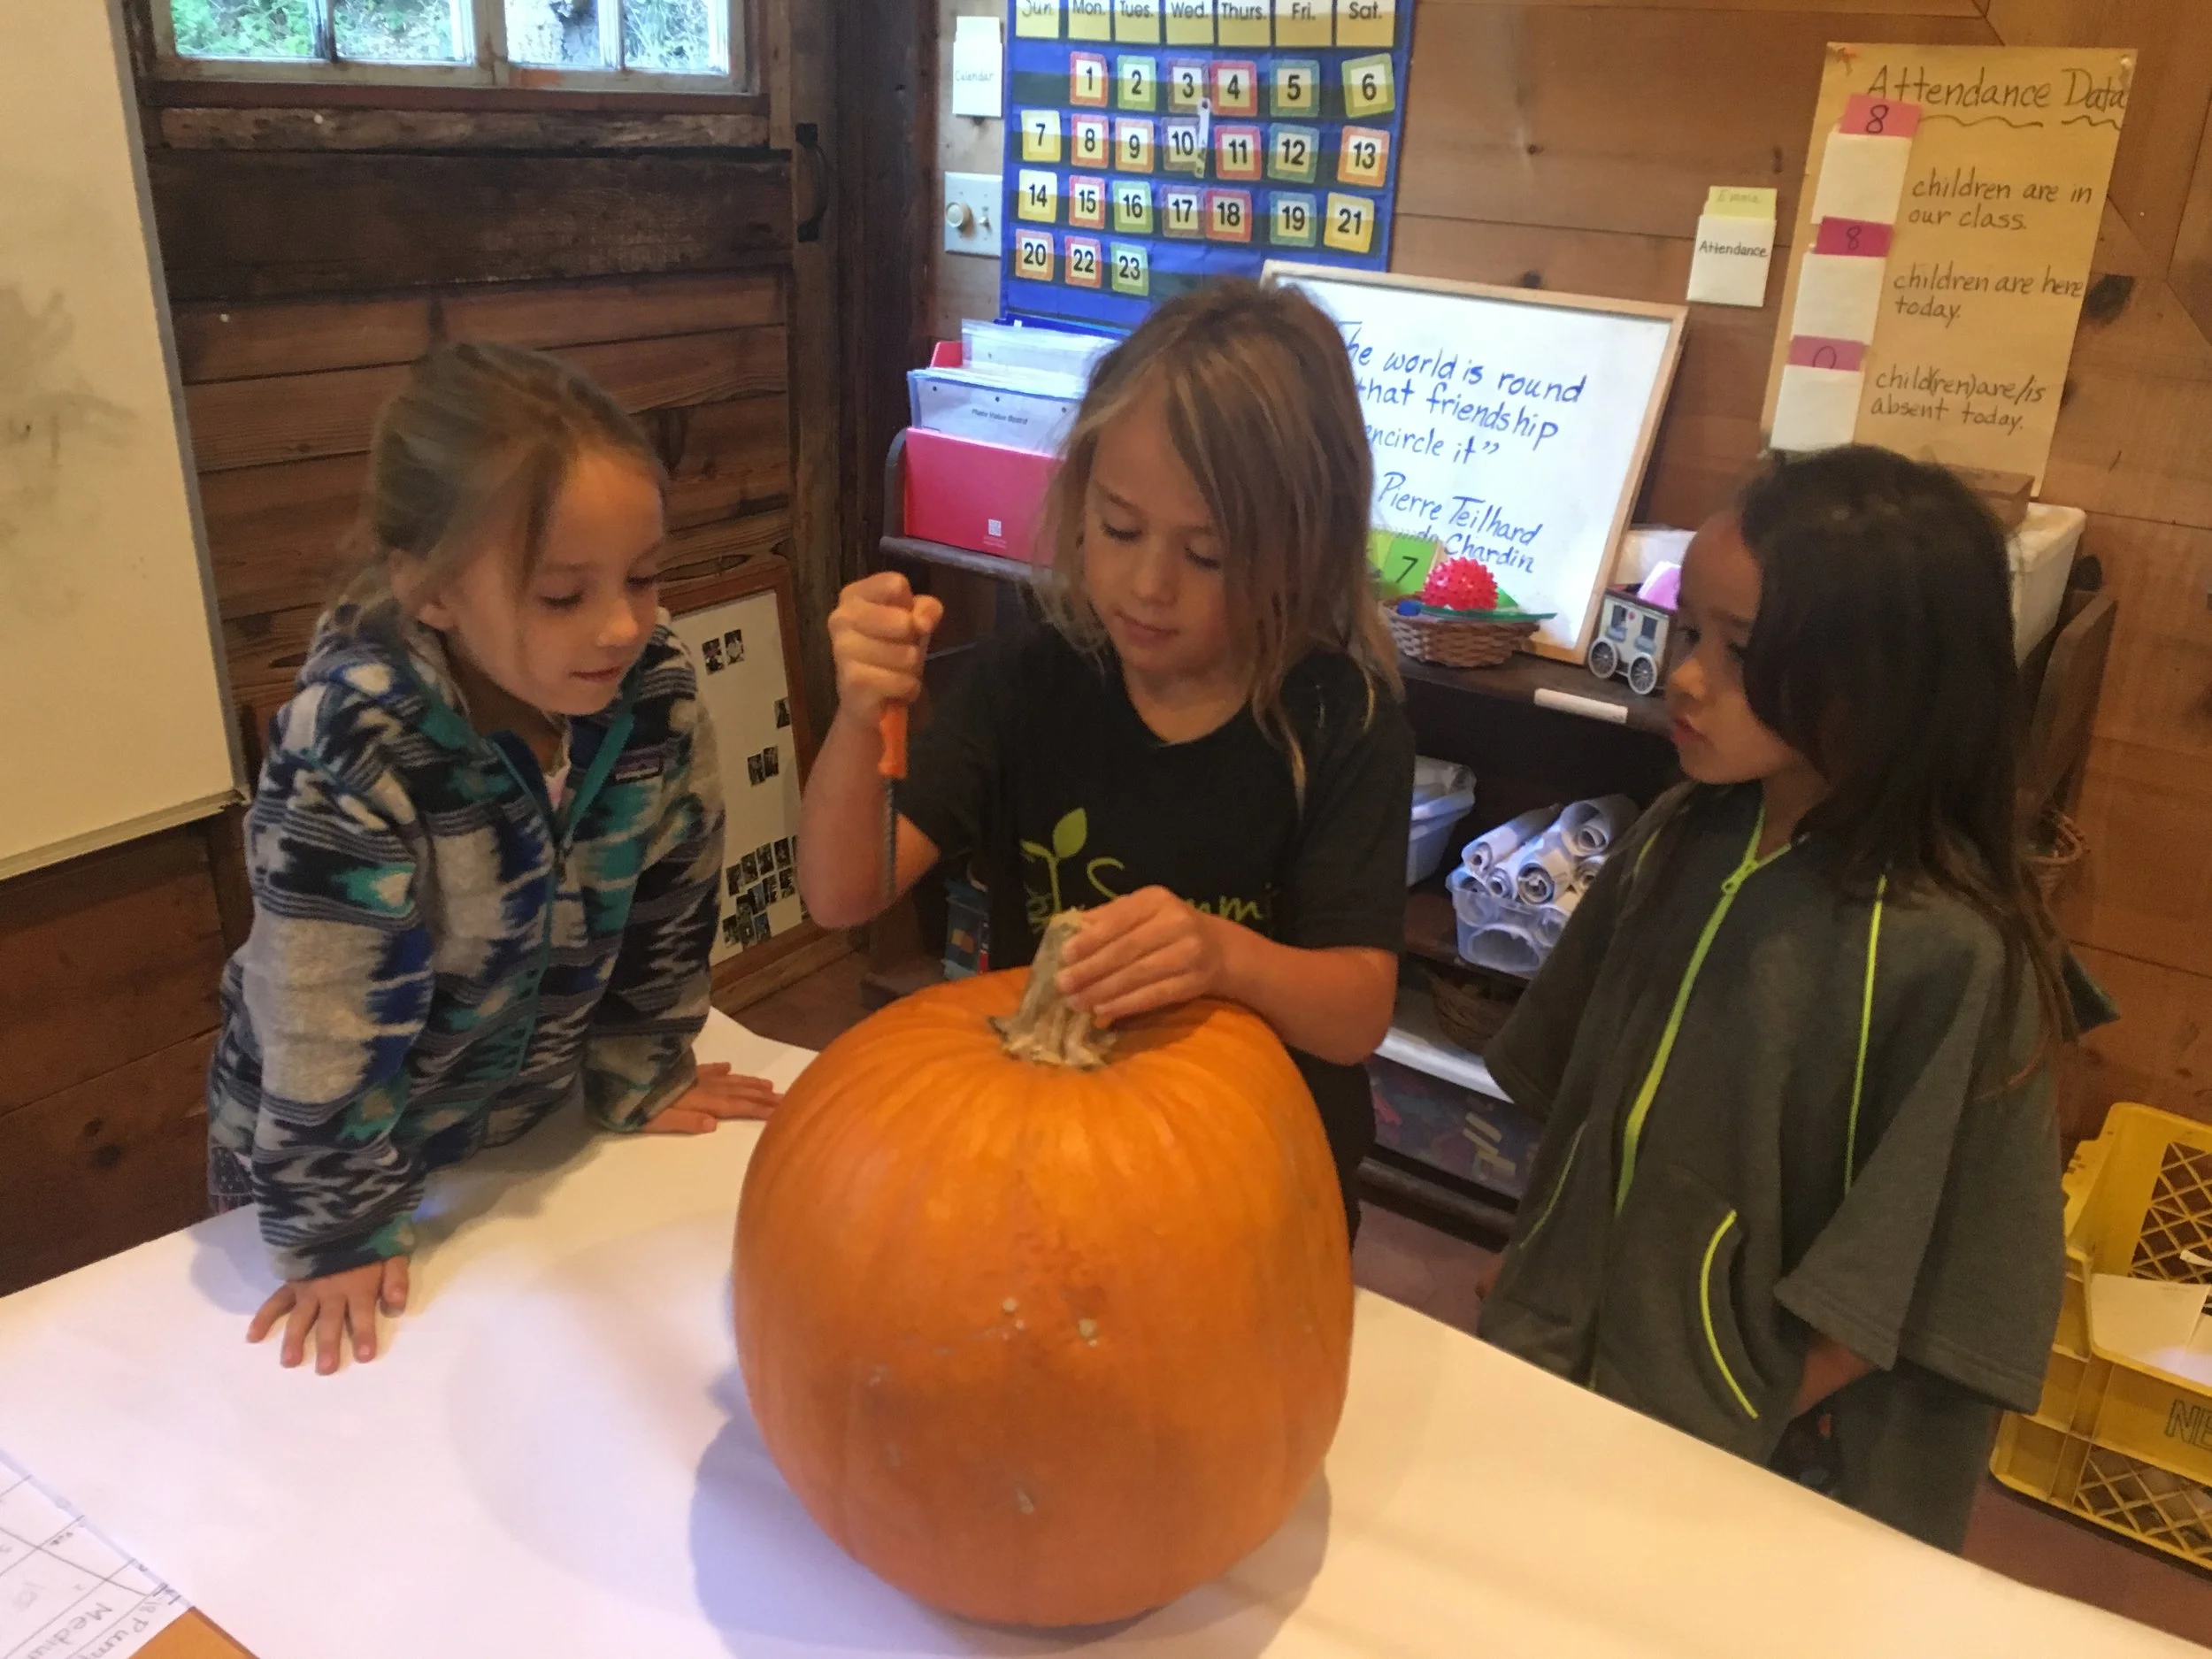
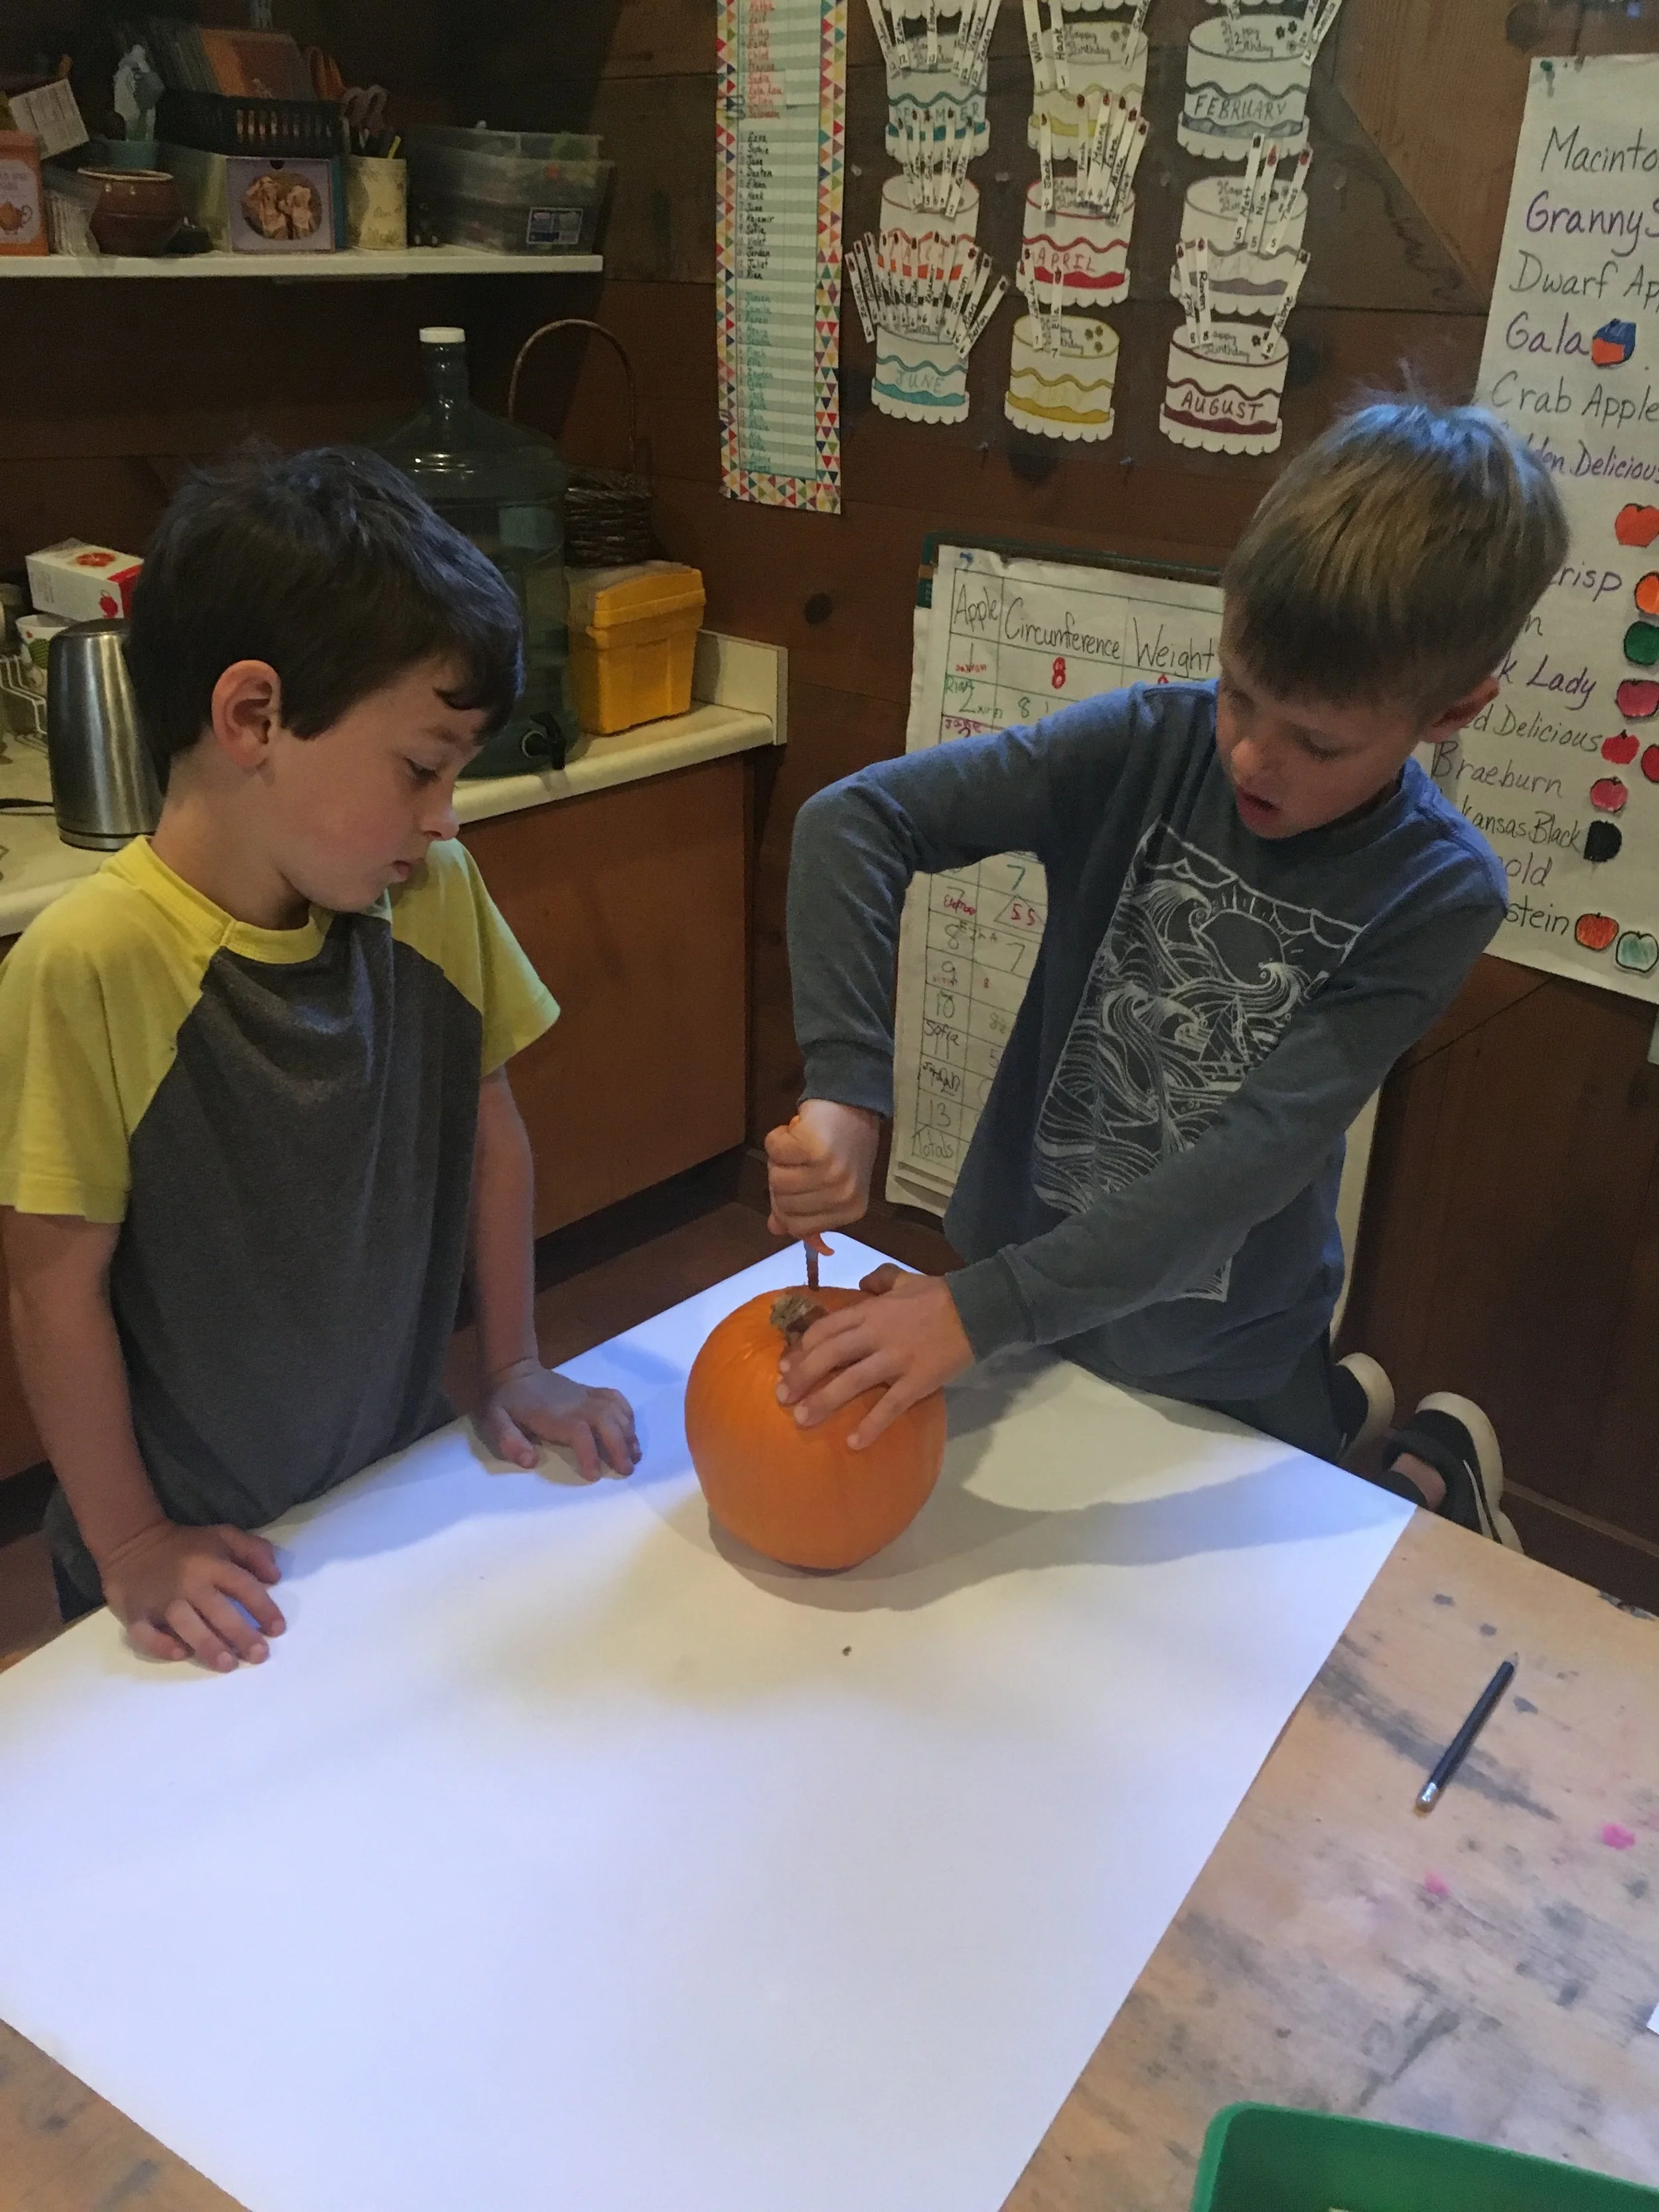
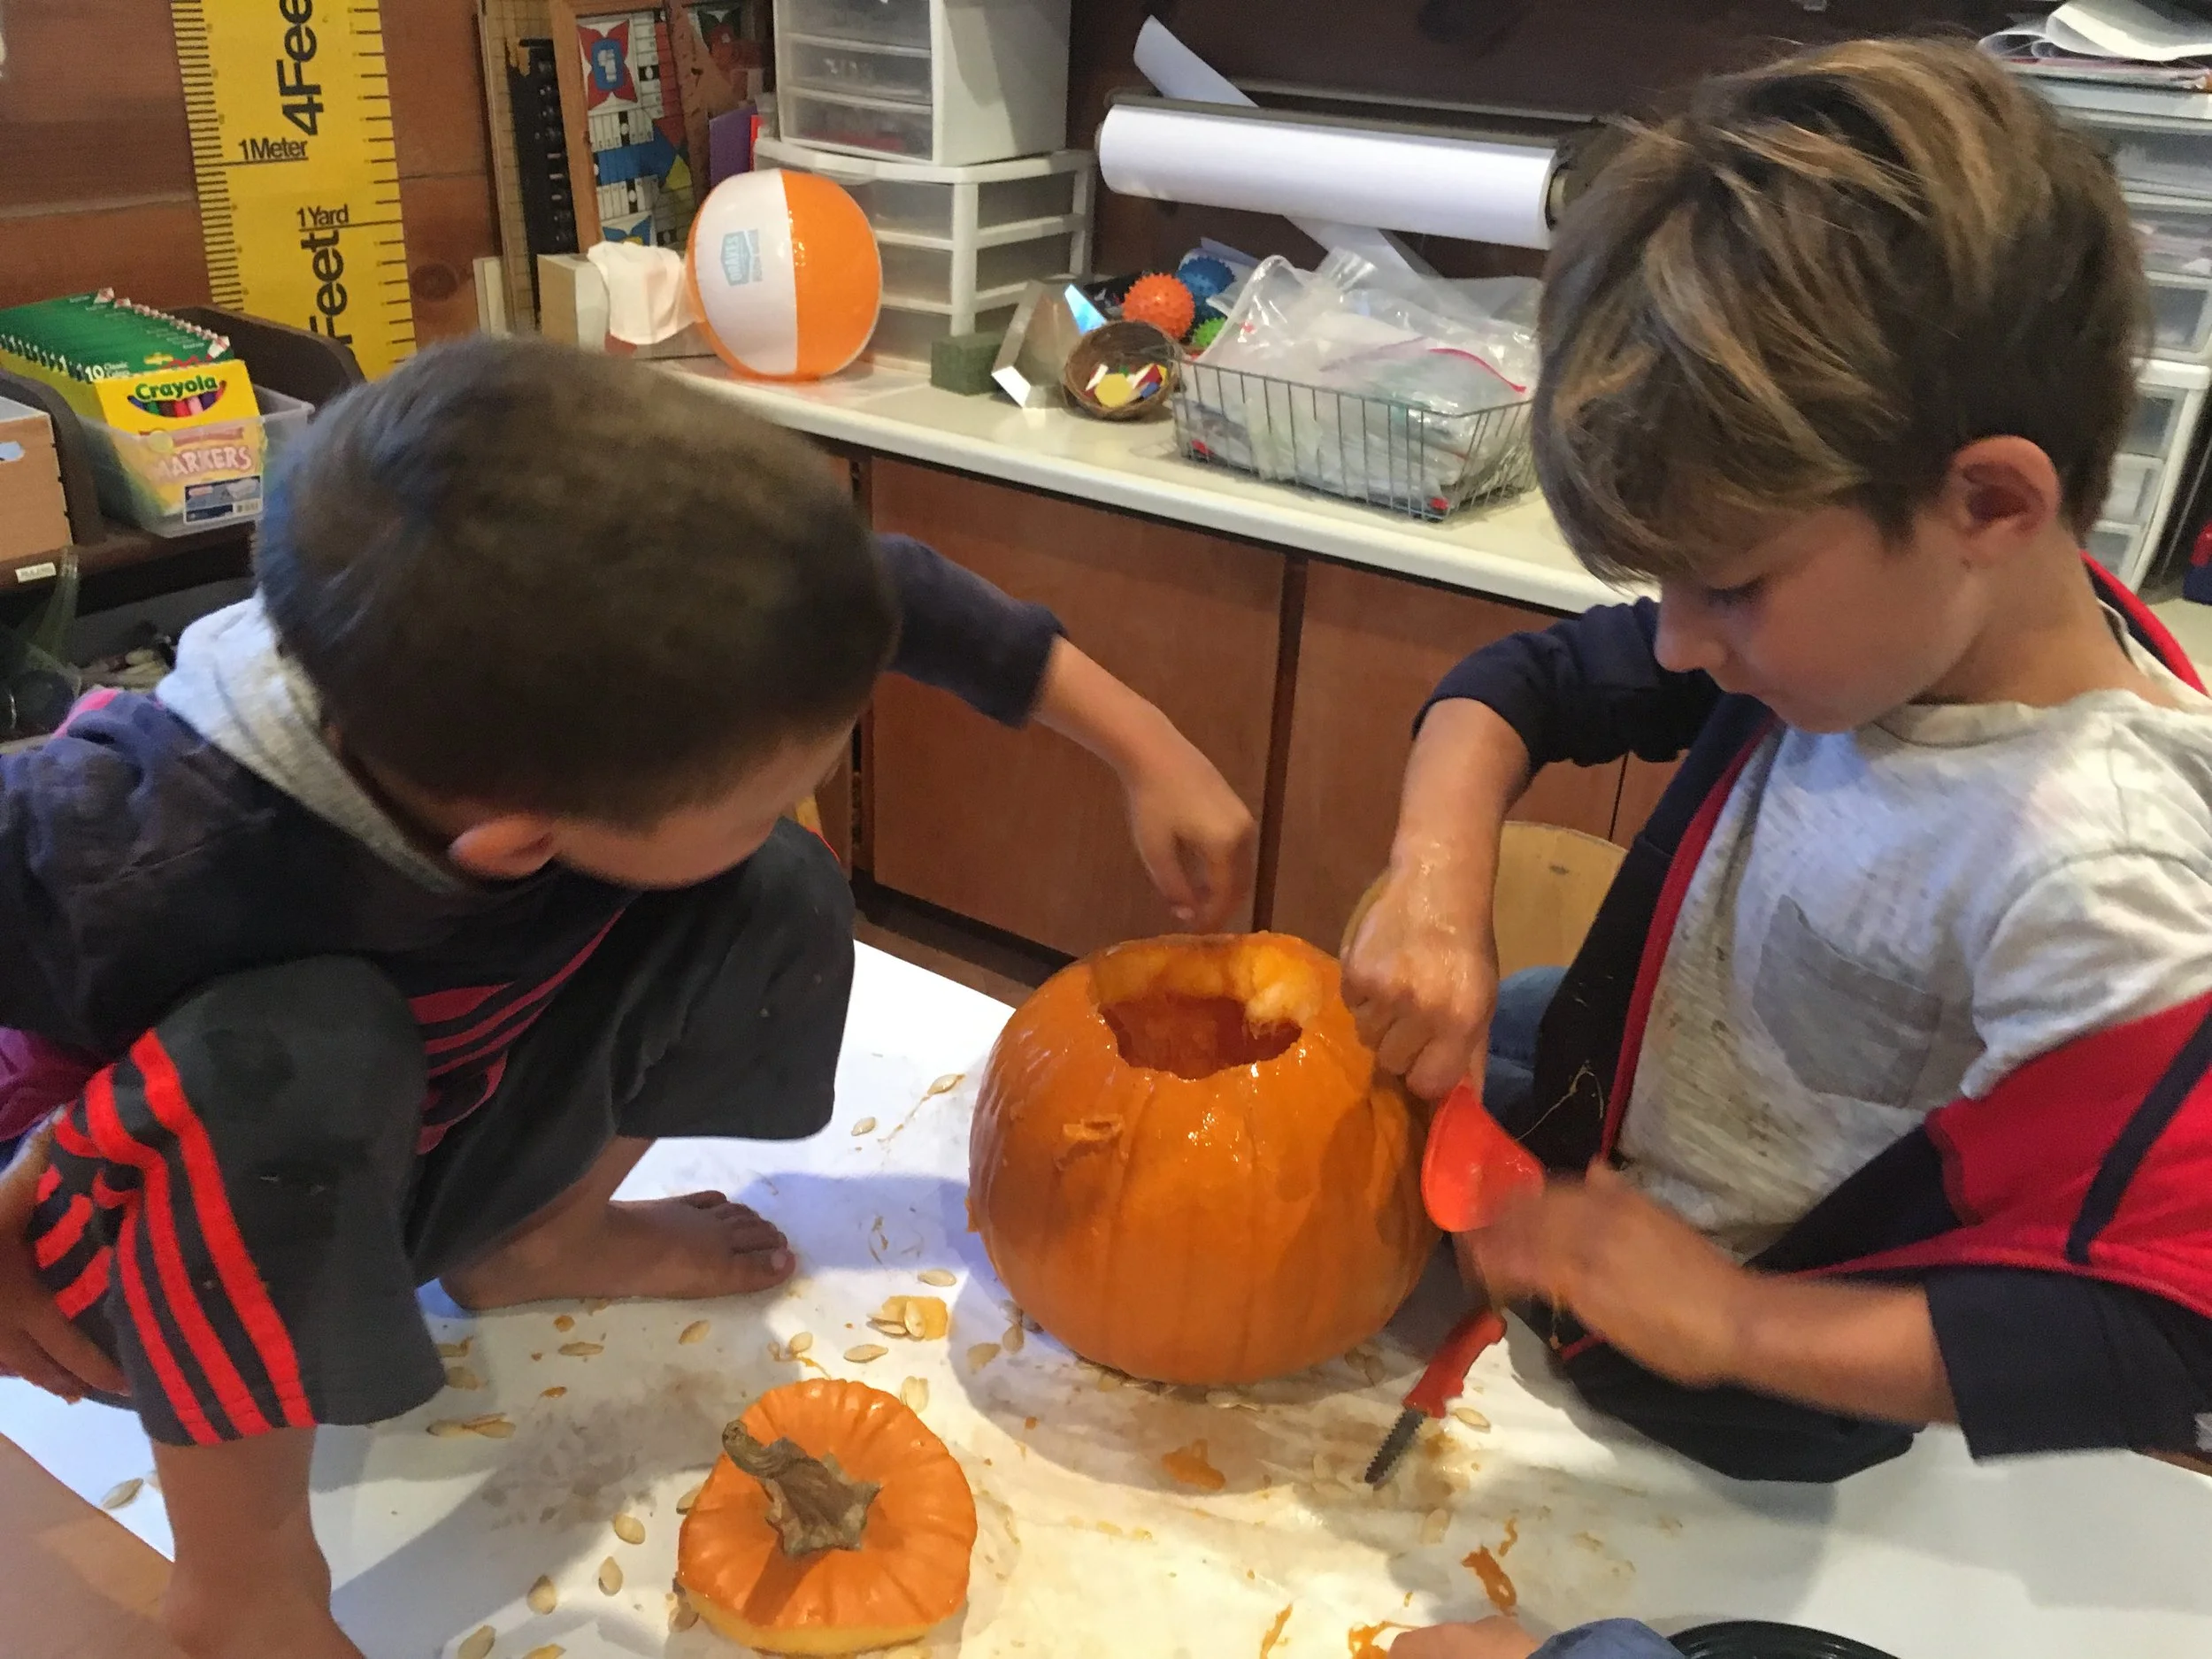
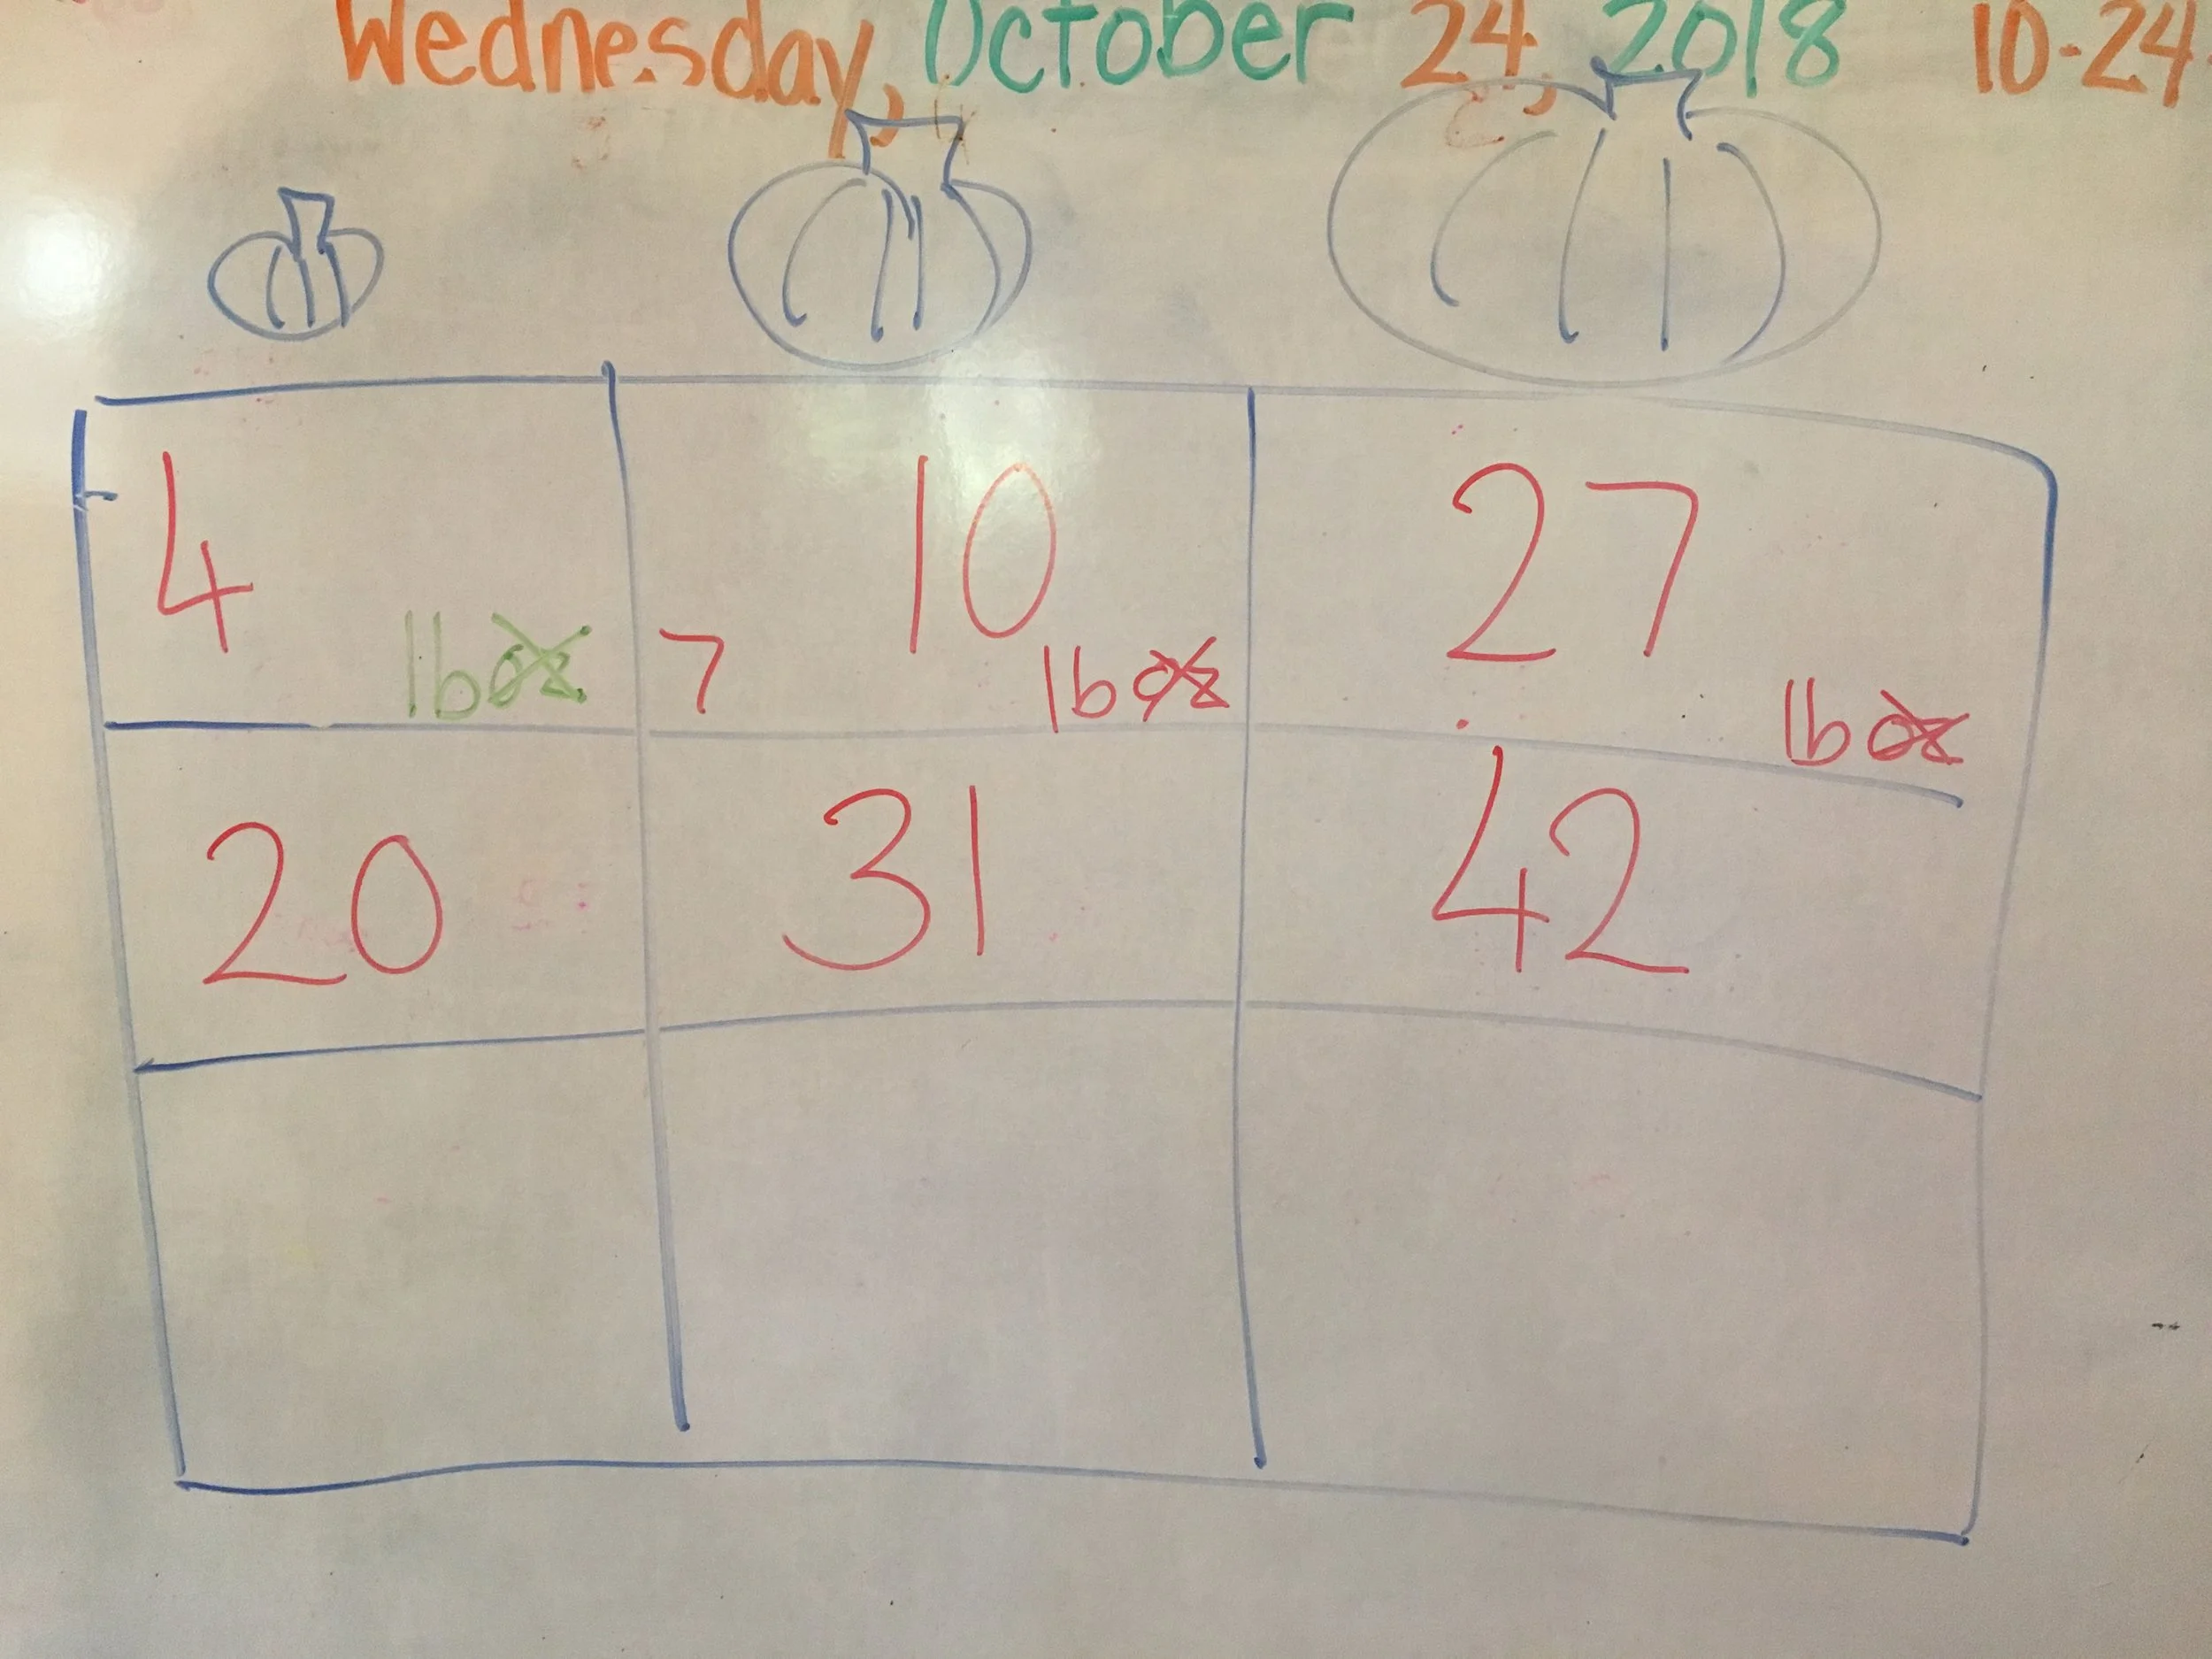
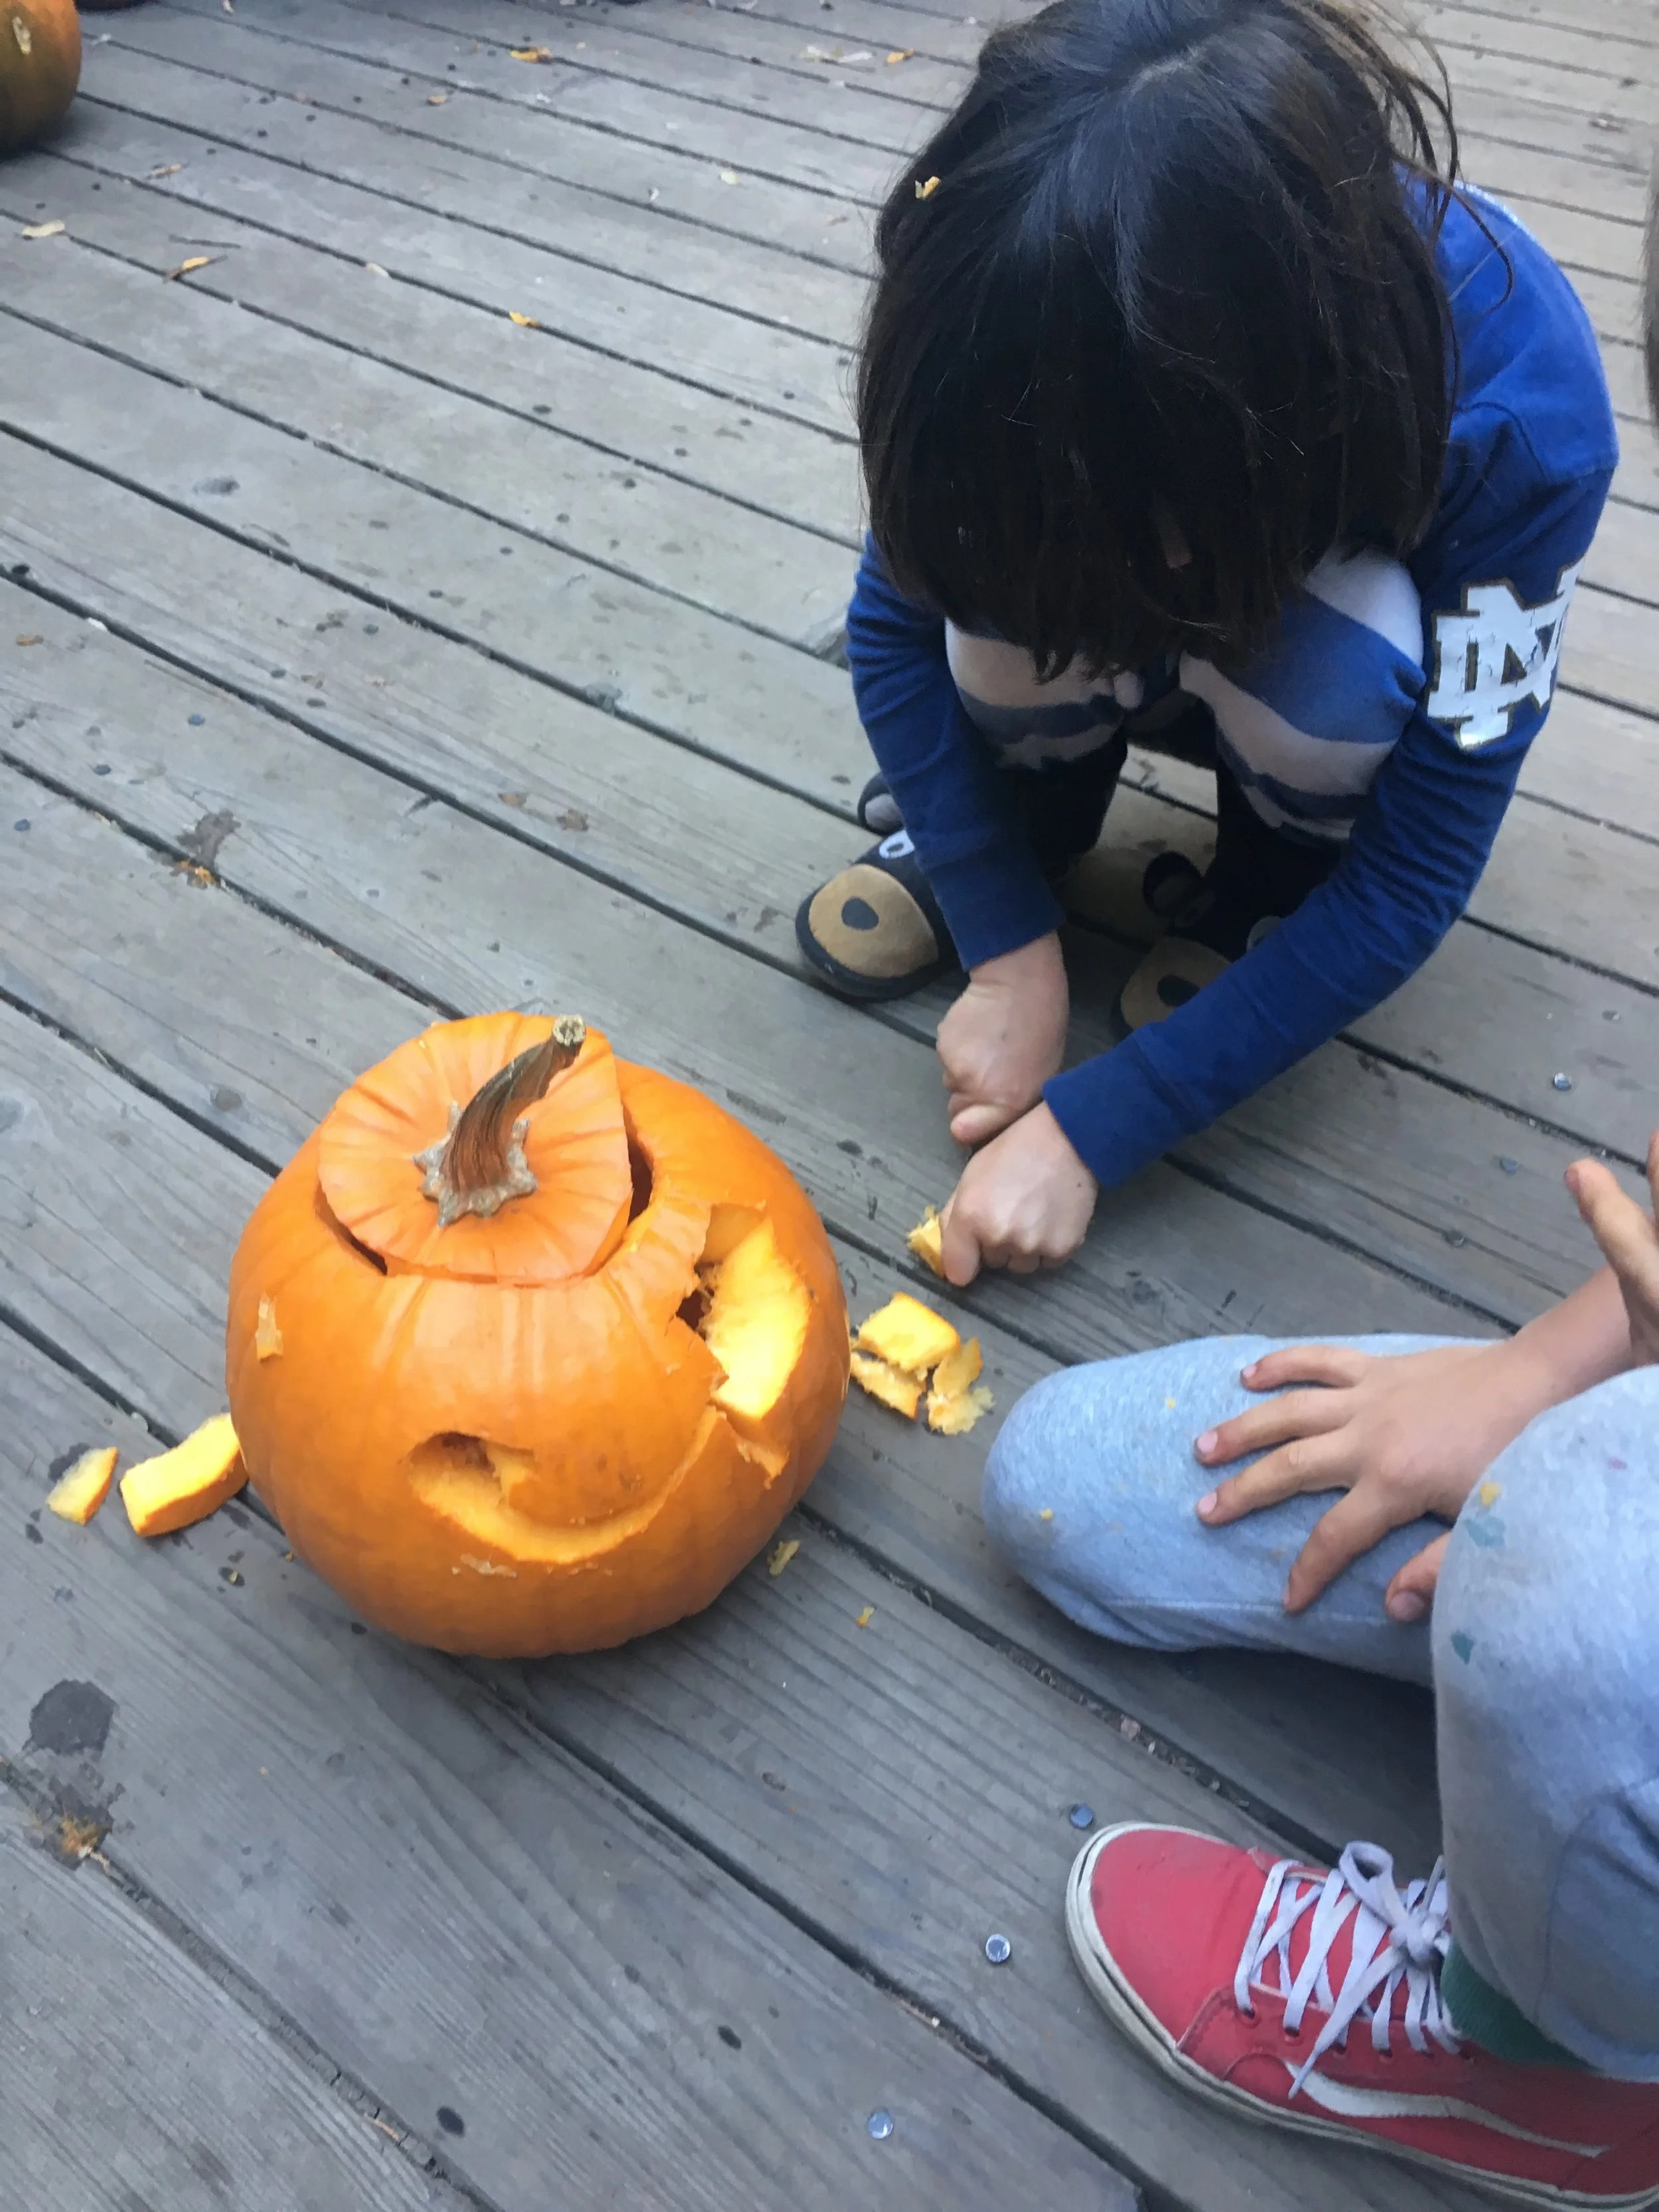
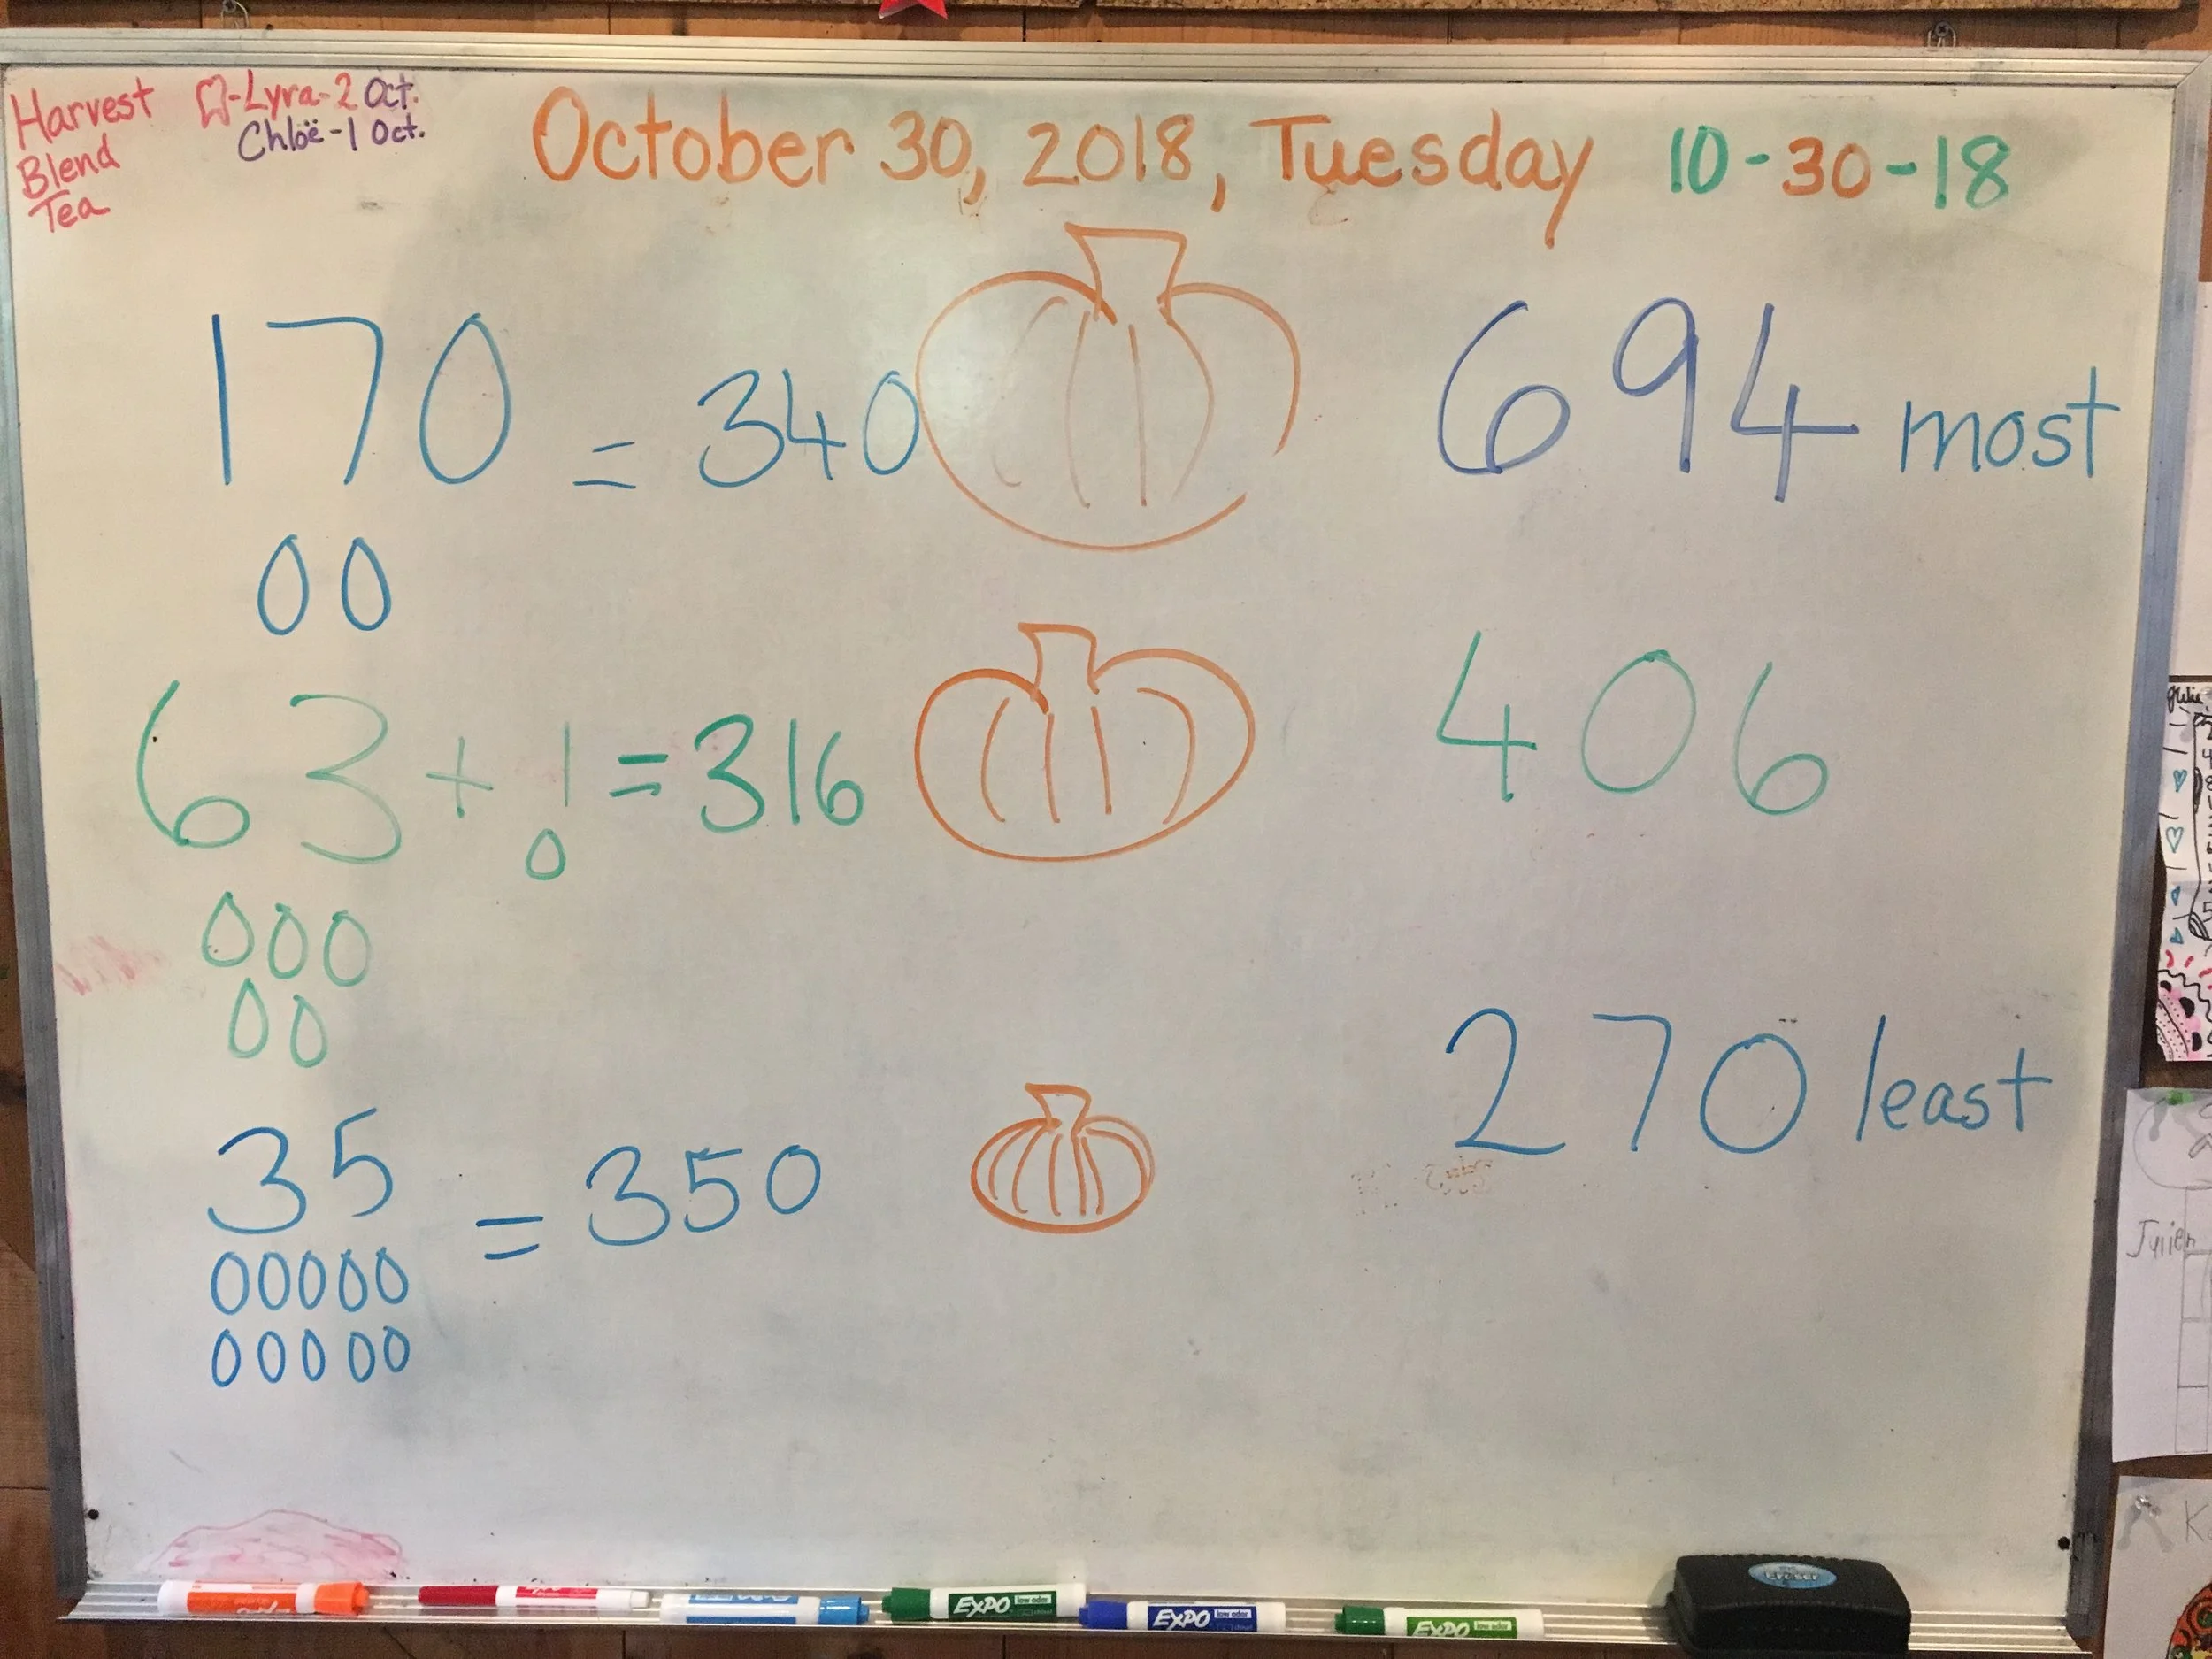
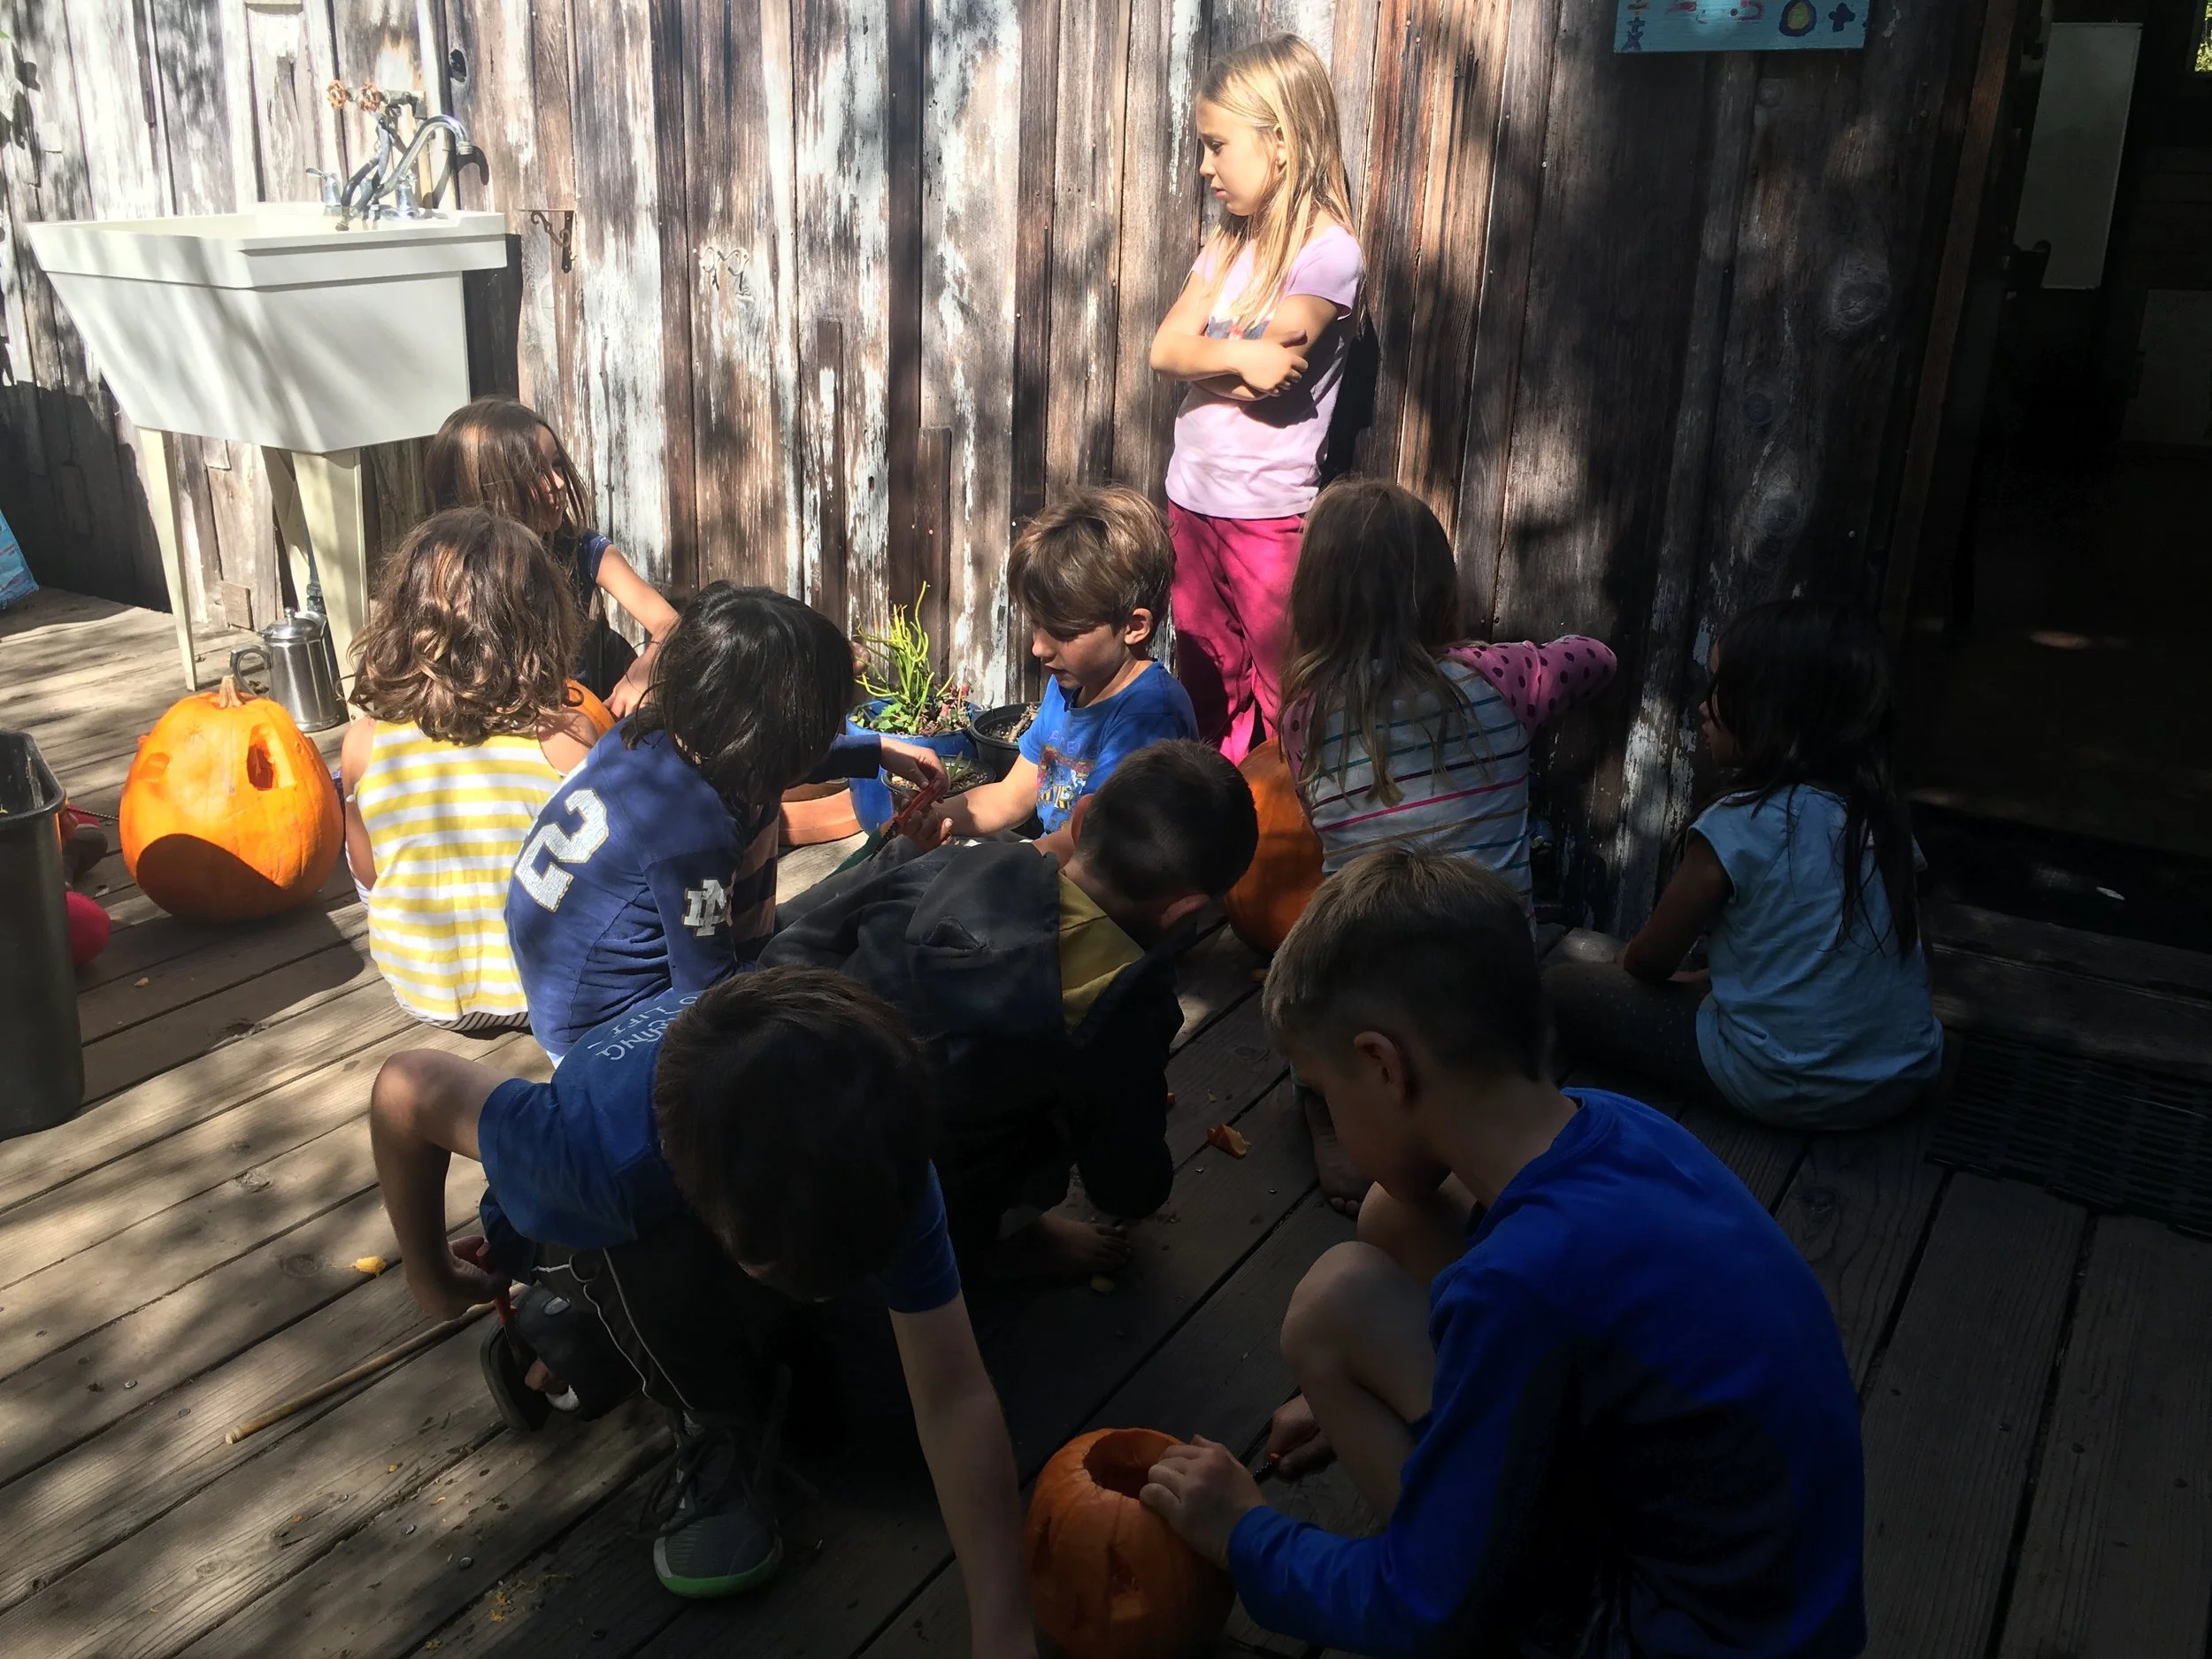
Measurement and Data continued with the Pumpkin Caper. I chose partnerships or triads and each group was given a pumpkin. We had large, medium, and small pumpkins. As a group, students were asked to predict the weight in pounds, circumference in inches, and number of seeds for each pumpkin. They wrote down their estimates and then the real work began. Each group weighed and measured their pumpkins, and then cut out the top and scooped out the slimy seeds. Some enjoyed the tactile experience and others less so. They then grouped their seeds by tens, fives, or twos and counted the number of seeds. Students found that it was easier to group by fives and harder to count by twos, although Finn and Jude developed a system whereby Finn had 17 groups of twos that he would fill and record and then start over, and Jude had 12 (I think) groups of twos that he would fill and record and then start over. Once all seeds were counted, students collaborated to carve their pumpkins. Bear, Mickey, and Jacen had three different ideas of how they would like to carve the medium pumpkin: dragon, cat, combination of the two. They problem solved and I think in the end it was a cat/dragon with wings that carved out most of the pumpkin.
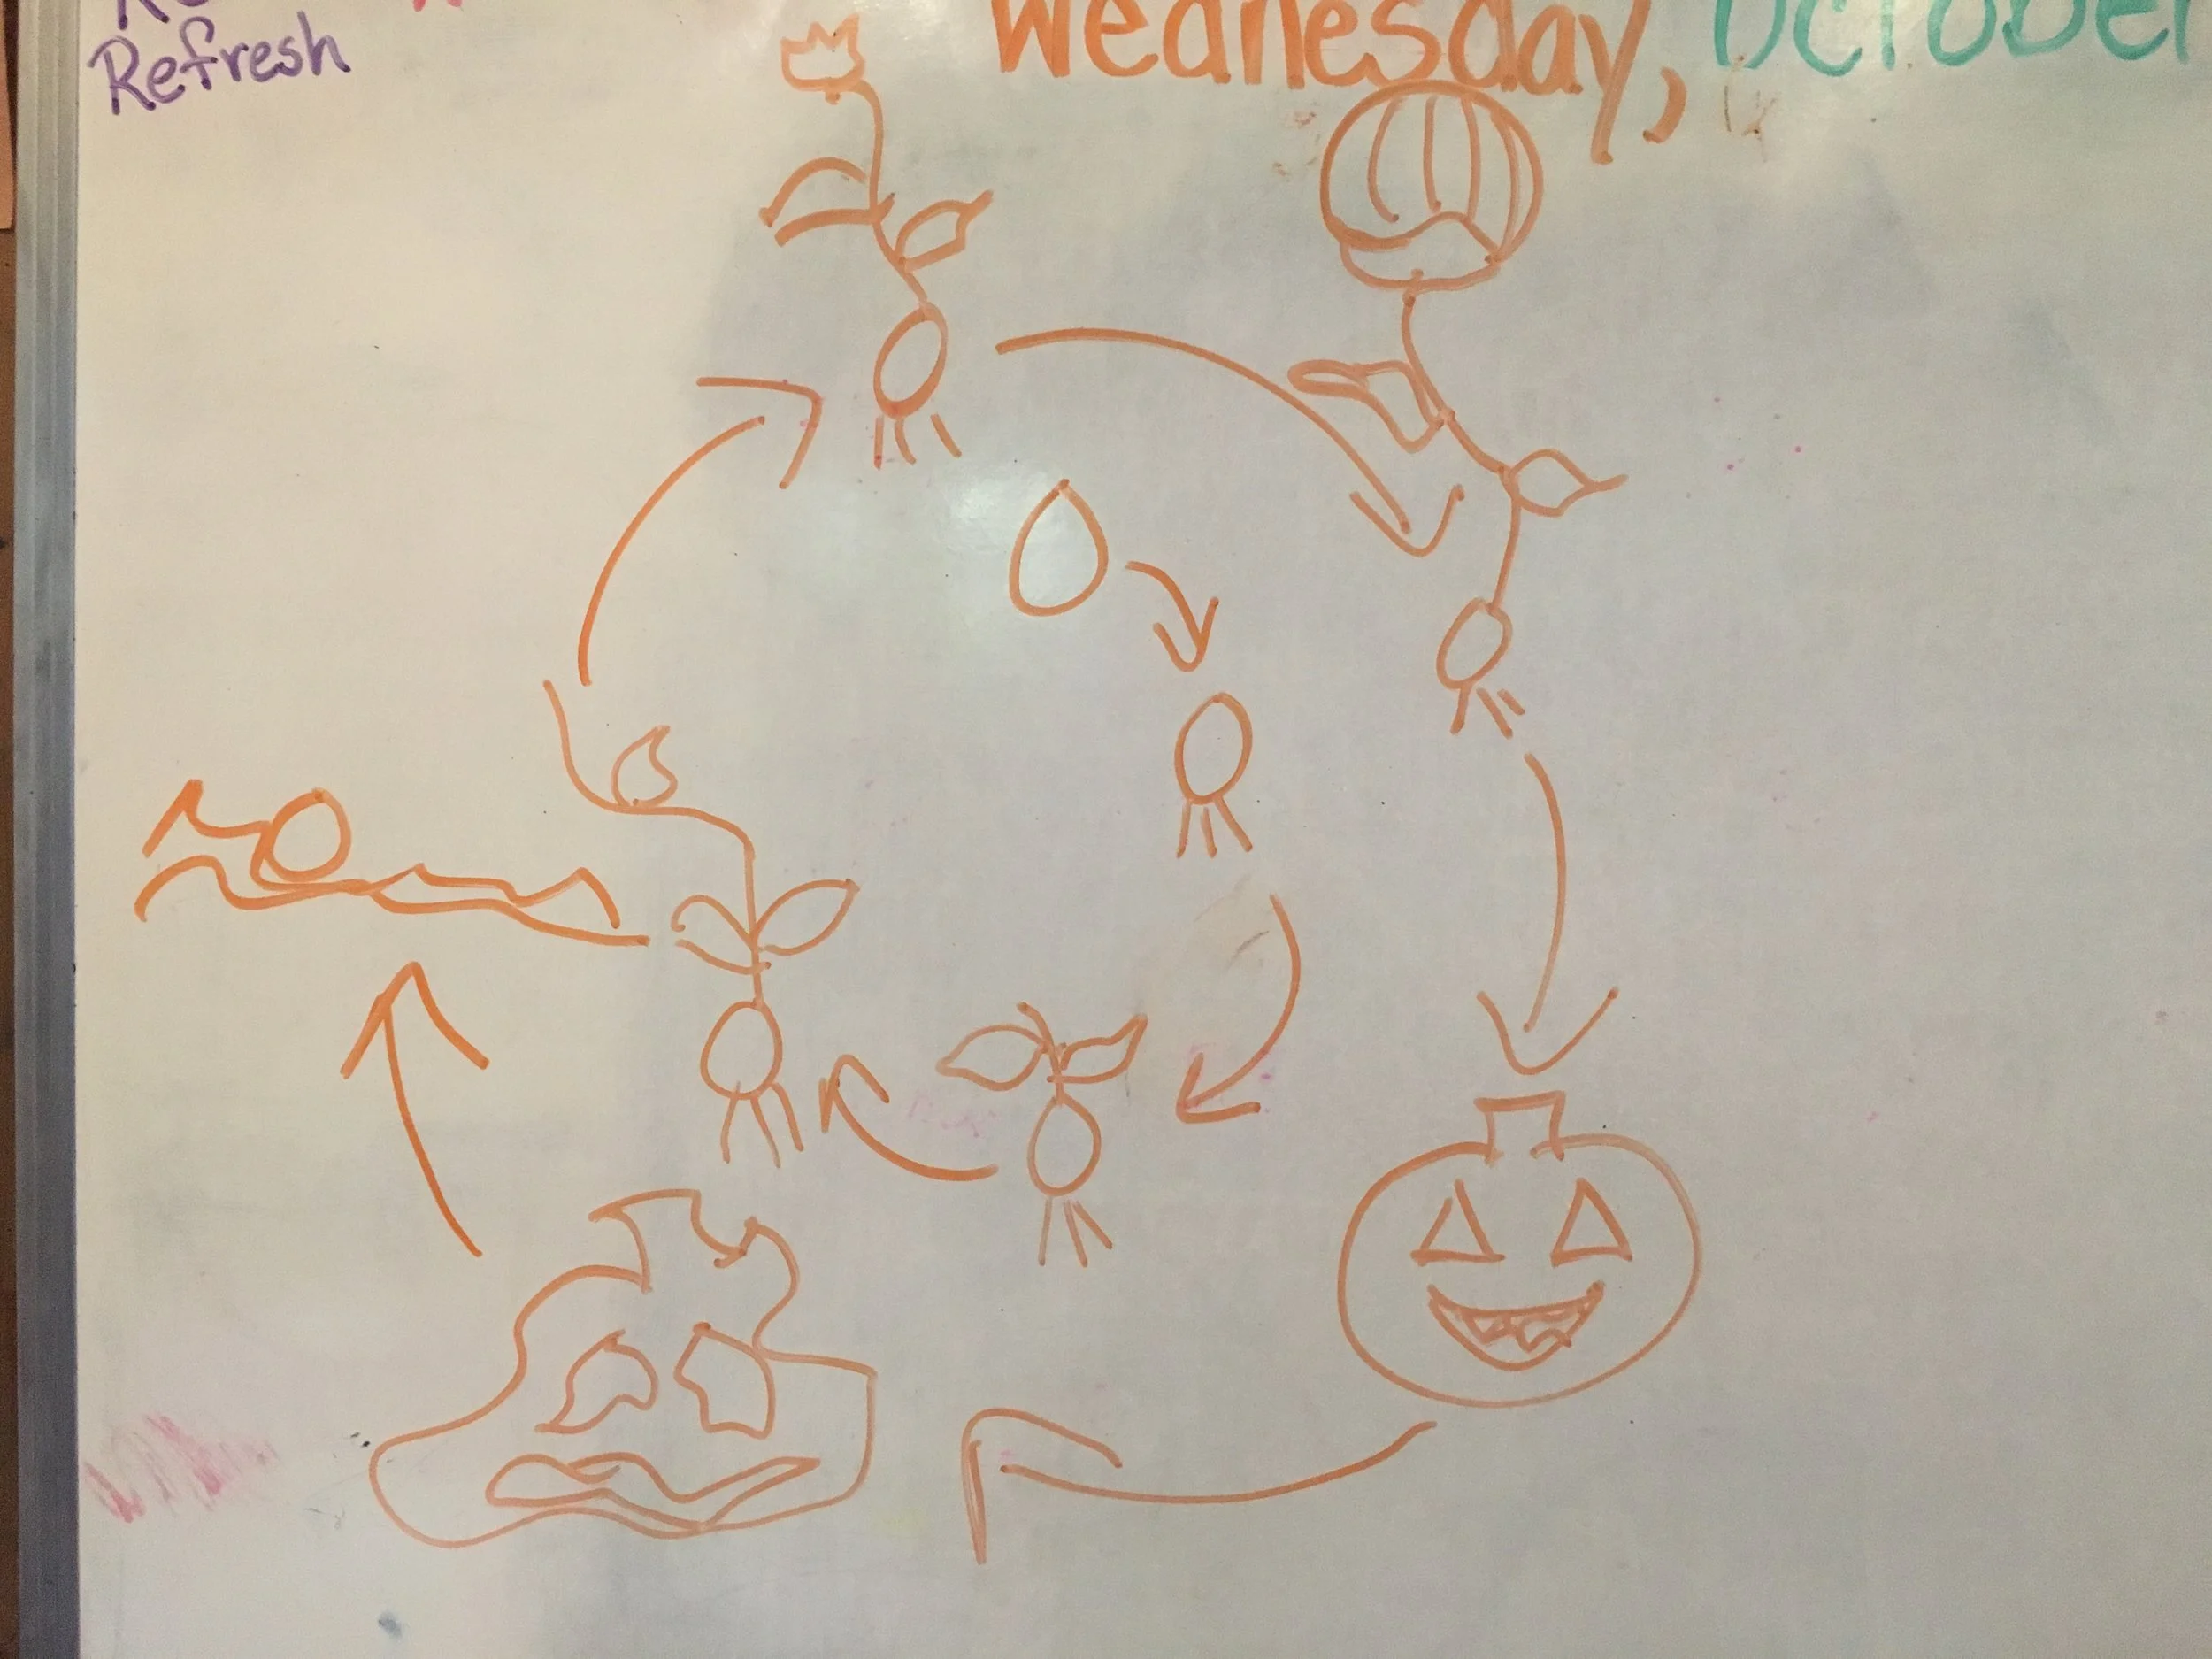
I also read a book with beautiful photographic illustrations called Pumpkin Circle which discussed the pumpkin life cycle, and together we discussed the pumpkin life cycle and connected it with gardening and science class. Students created mind maps of all the things we can do with pumpkins.
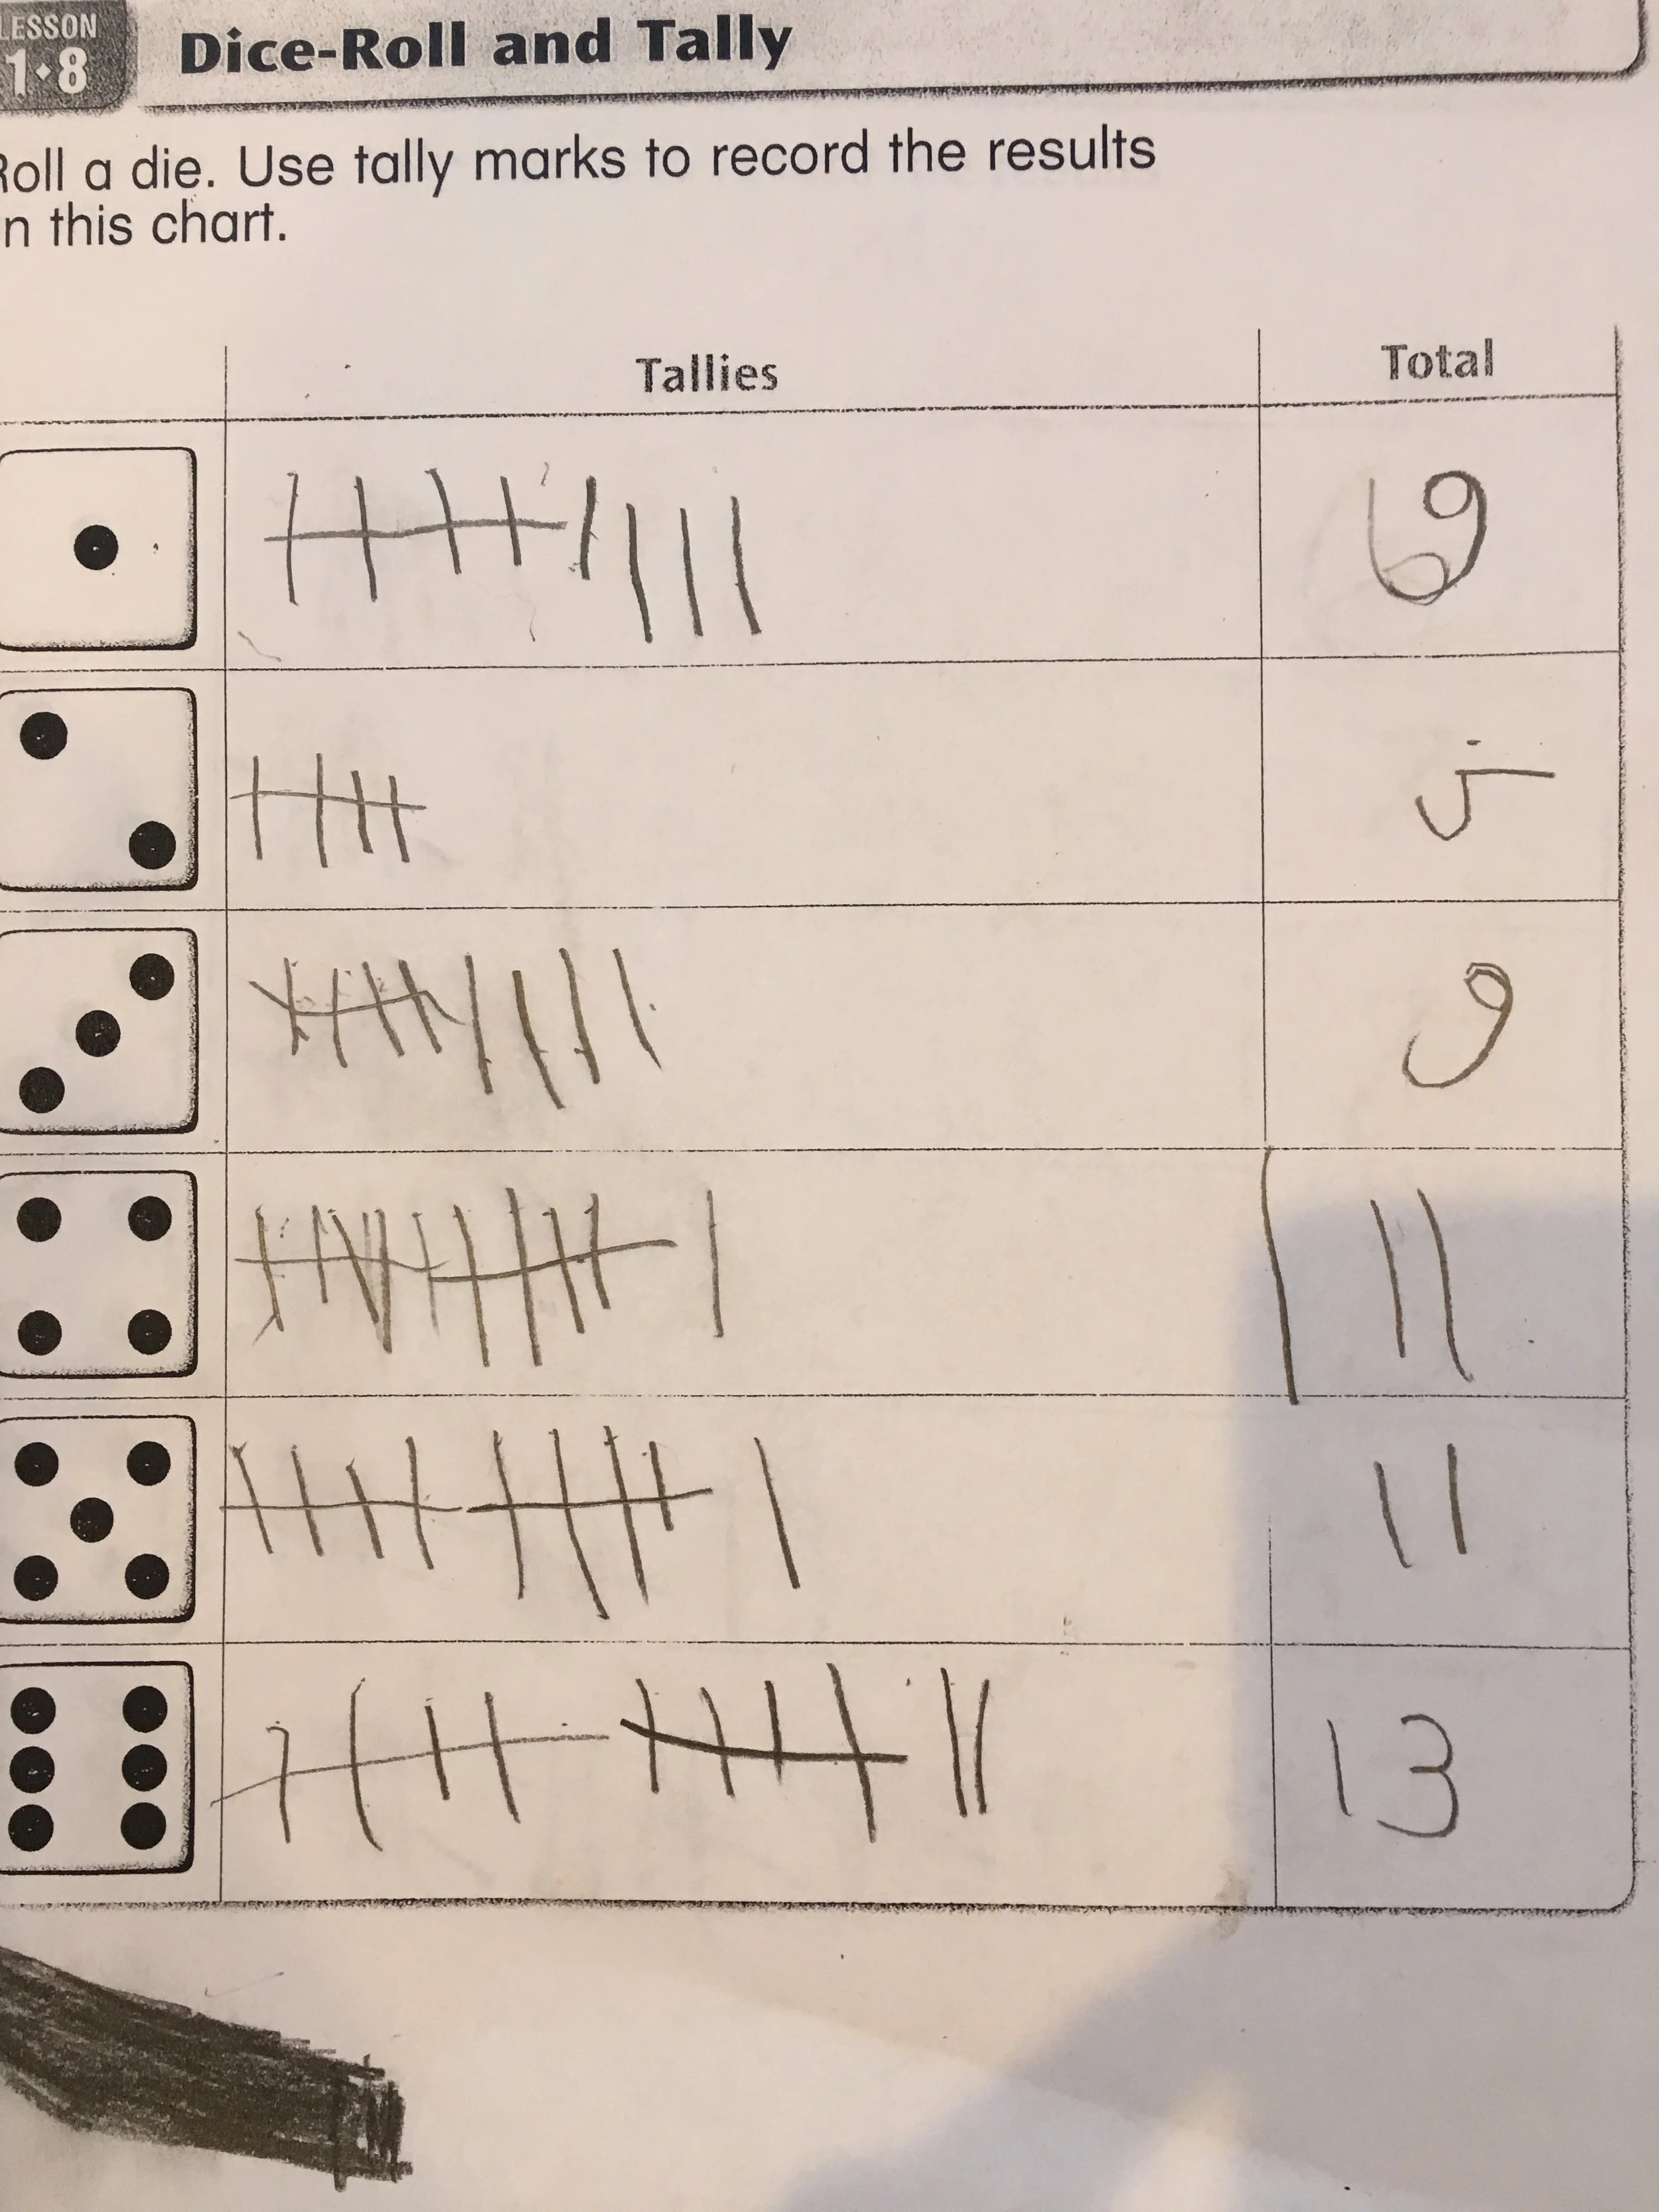
In our Everyday Math lessons, we continued to work with tally marks, encourage use of them at home and pay attention to whether or not they are crossing every fifth mark. Students are working on recognizing the group of five tally marks; they have had a lot of practice counting by 5s from recording the money for Drive for Schools. Our lessons on tally marks have included tally counts (recording the number of pennies they hear being dropped into a container), t- chart of pet owners in our class, and a lesson called Dice Roll and Tally which includes probability (which number gets rolled most often). The weekly weather job is to record the weather on a graph using tally marks so that is ongoing.
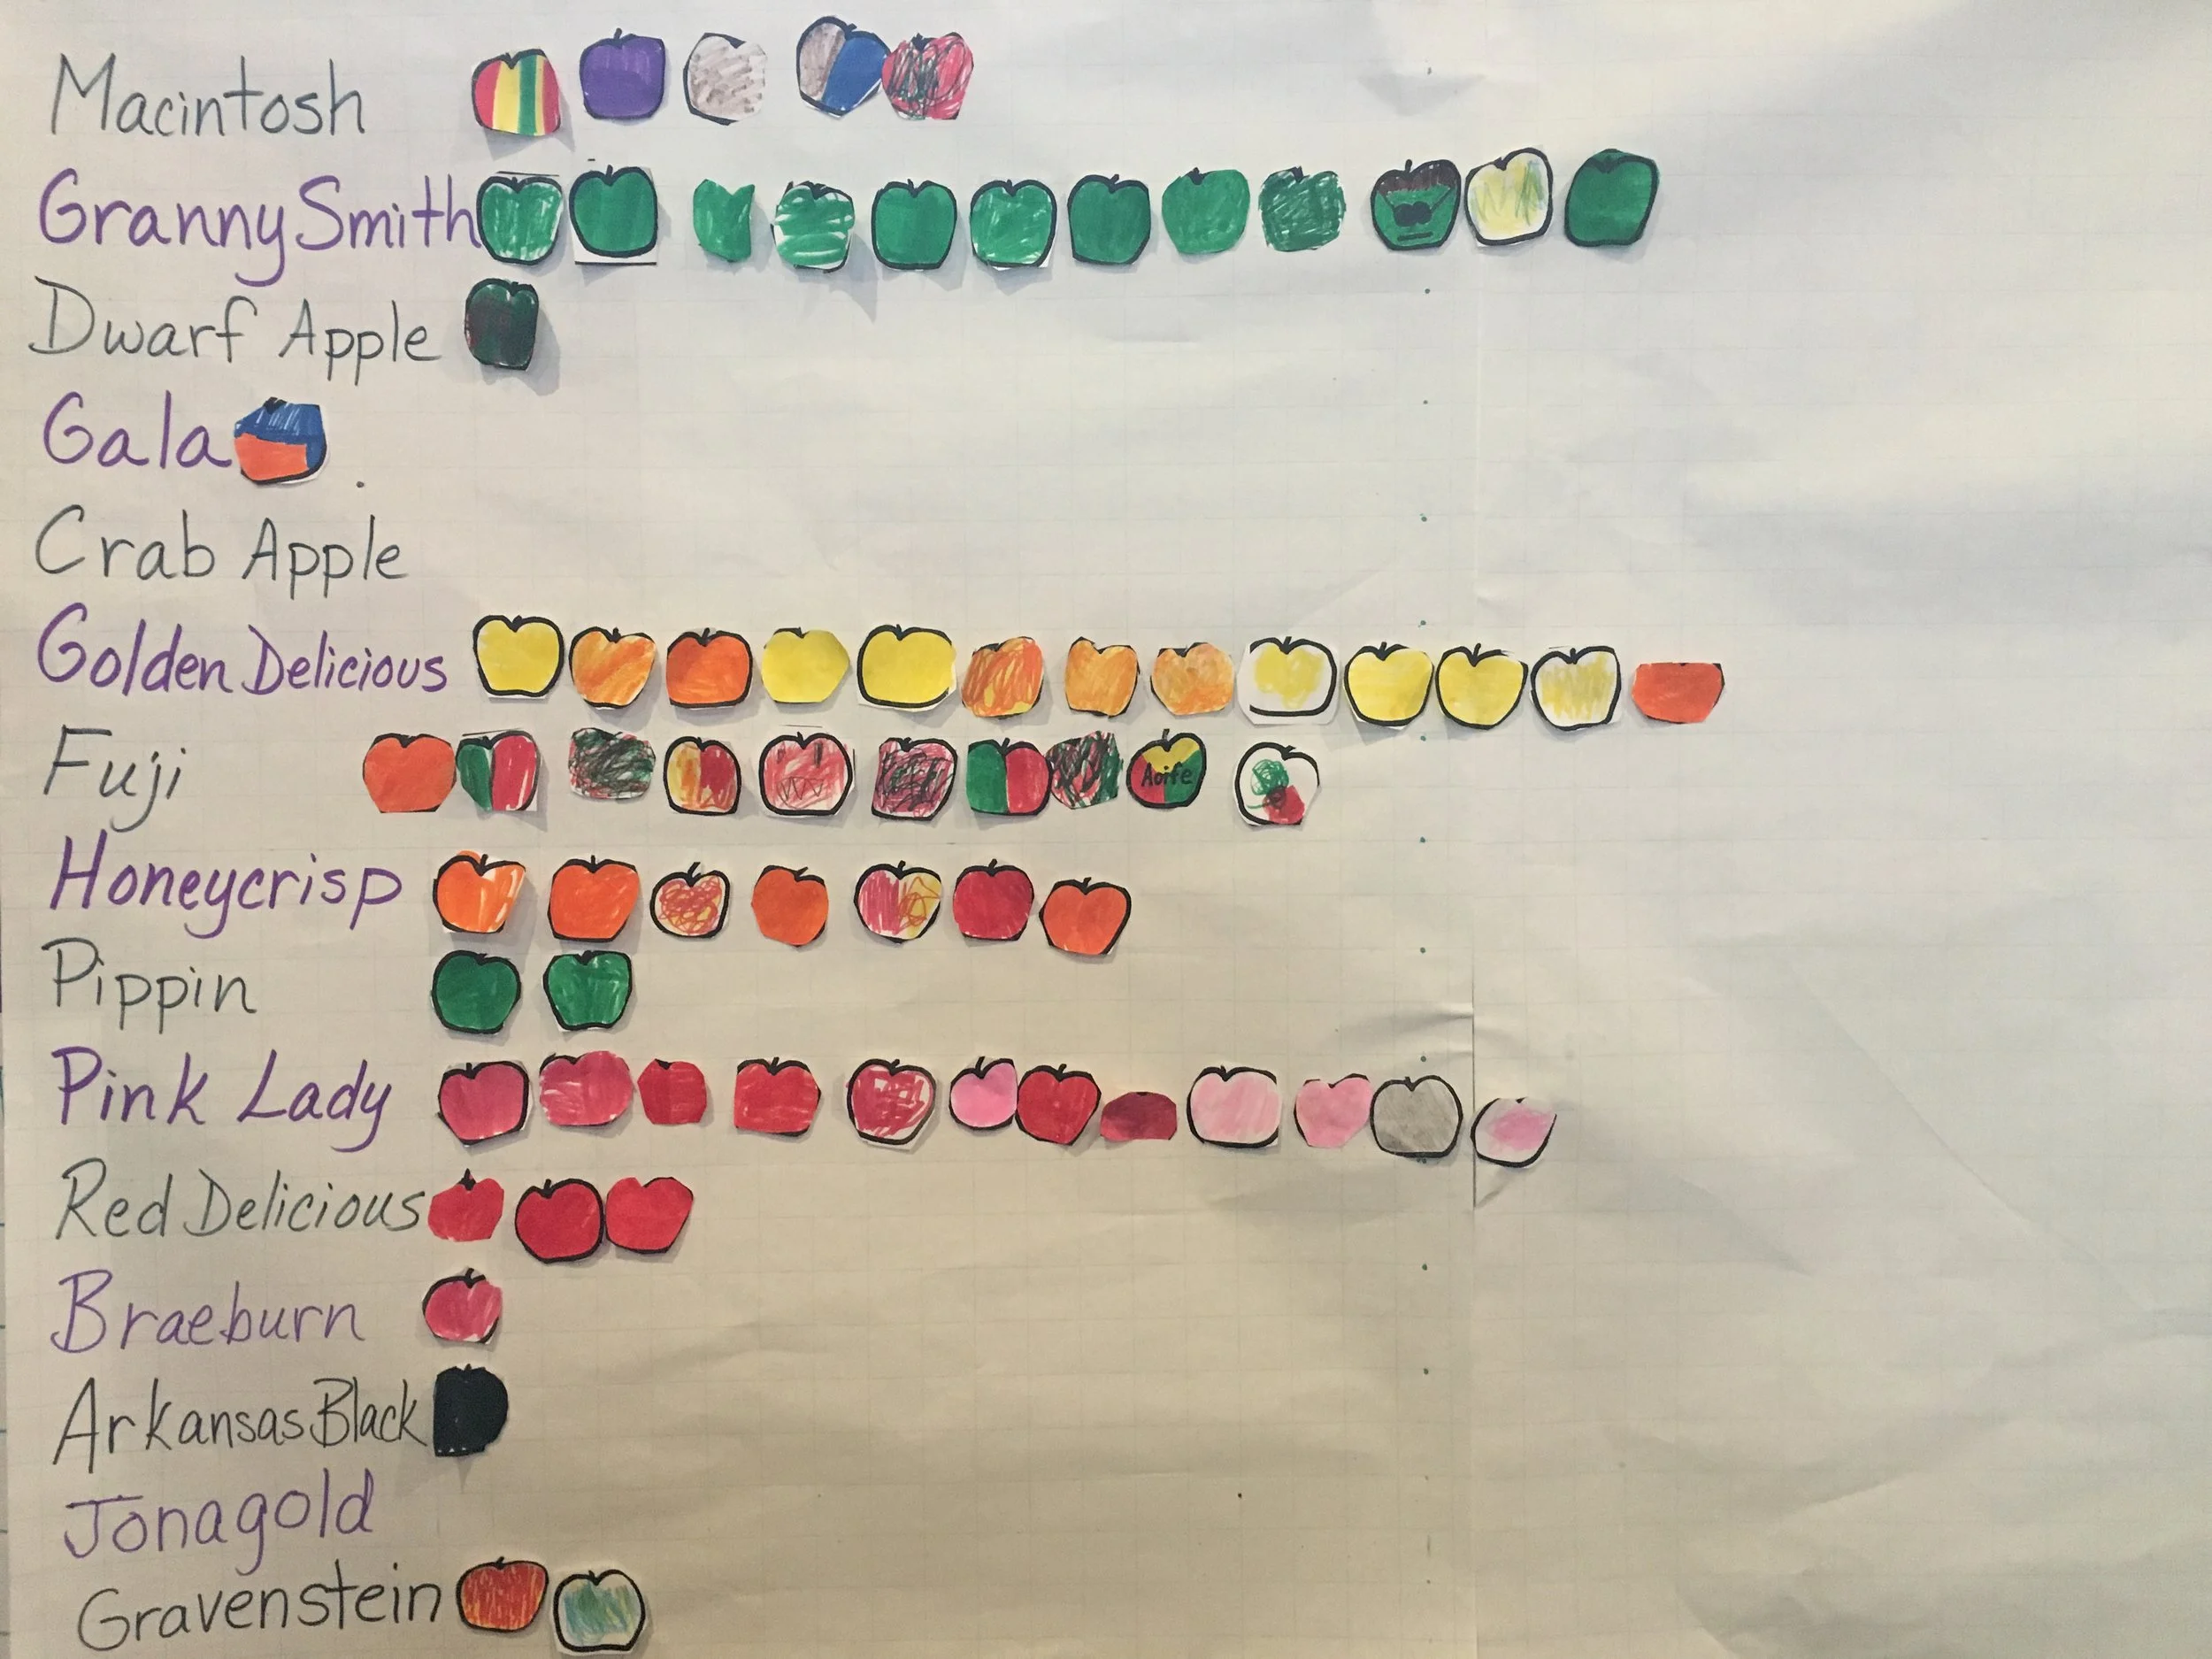
Students also worked on a graph in which they recorded people’s favorite apples. This is a great visual as students color in an apple for each person and glue it onto a class graph.
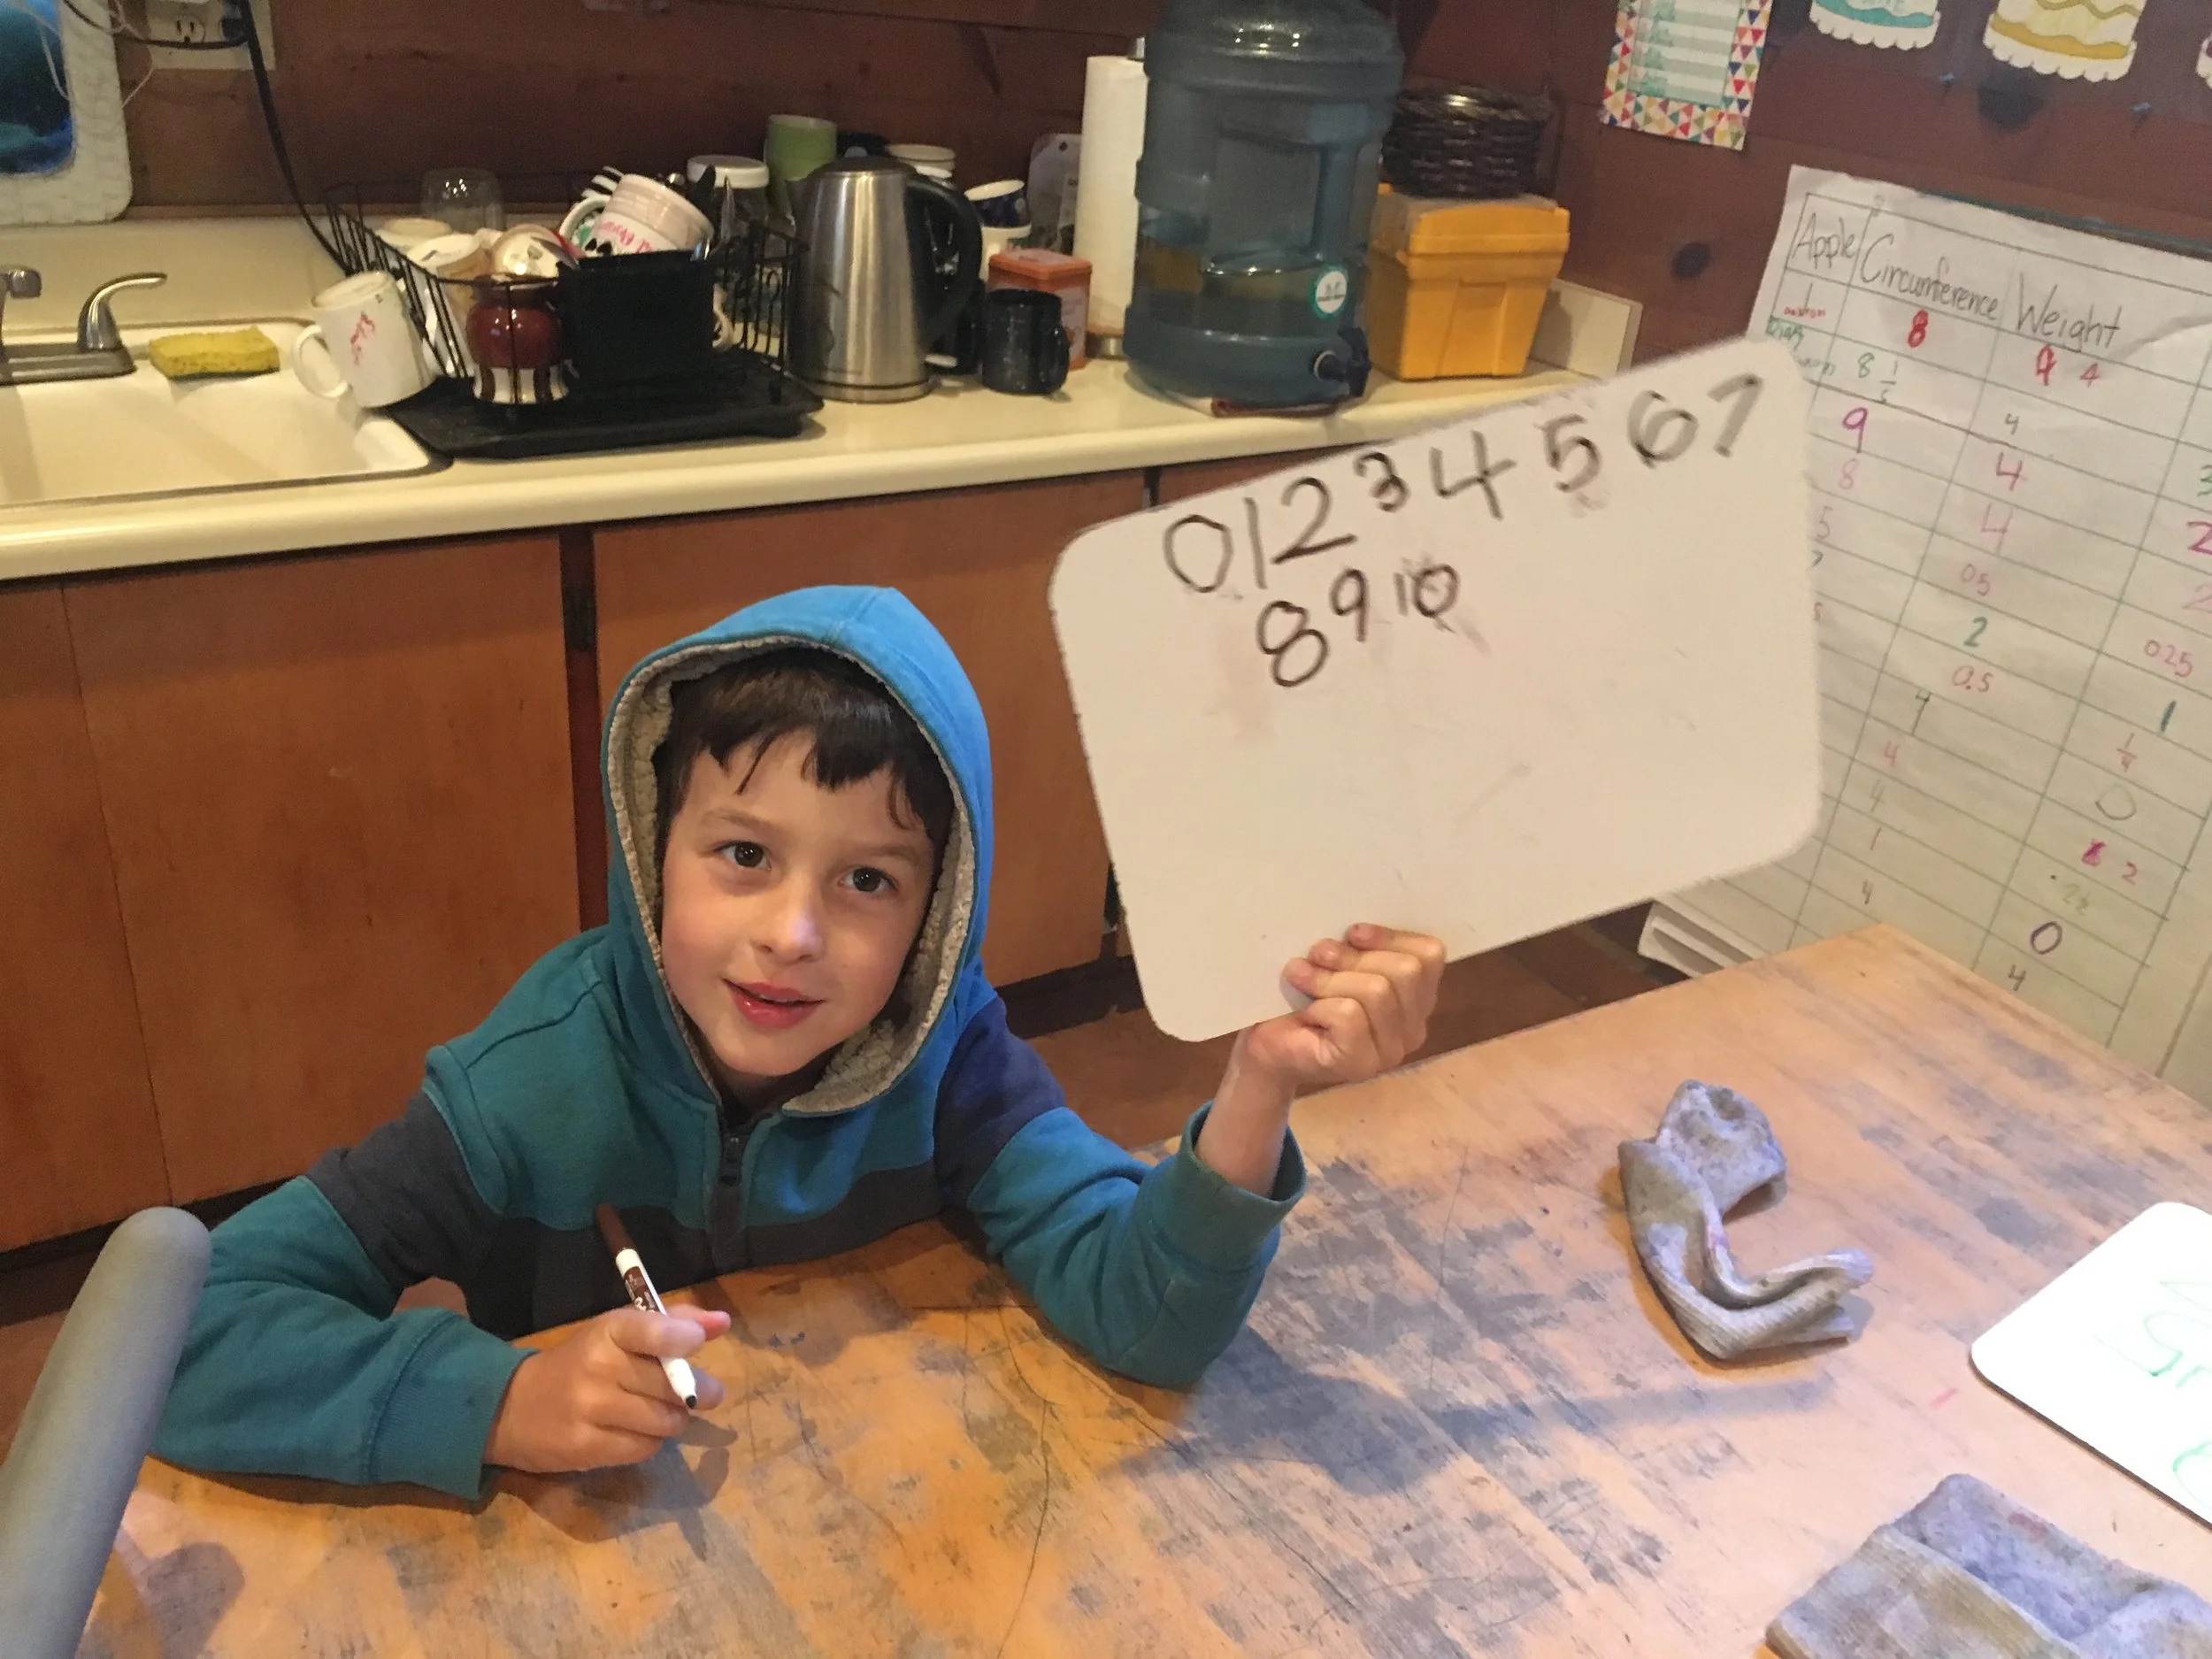
Besides graphing, students began their number scrolls. The first 100 is somewhat easier because one can use a hundred chart to help. After that, the class number line is a good support because it goes up to 180. And then, students begin to develop their personal strategies for understanding place value. I point out that each column ends with the same number. Our students are excited to be working on this concept, especially since several have seen the scrolls of older siblings or other students.